Develop. Test. Debug. Automate.
We provide tools that help you test and debug the software that you develop.
You can also automate their usage for use in your unit tests, smoke tests and regression tests.
We help you to find and fix bugs faster, and more reliably.
Our goal is to make you more productive and successful.
A change in perspective is worth 80 IQ points
Are you tired of tools that collect lots of valuable data but then don’t allow you to inspect that data thoroughly?
Just looking at the problem (or the data) in a different way can let you see the problem differently. The “Eureka!” moment.
Following this philosophy, we’ve created tools that provide multiple ways of inspecting and querying your data, allowing you to understand aspects of your software that were previously unavailable to you.
Applications, Services and IIS
Applications
Modern software engineering practices mean that many technologies are in use. Compiled software (native) and just-in-time compiled software (.Net) are used for many applications. Some applications use both technologies. Whichever way you develop, we have tools that support those technologies.
- Native applications.
- .Net applications.
- .Net Core applications.
- Mixed mode applications (native and .Net technology in the same application).
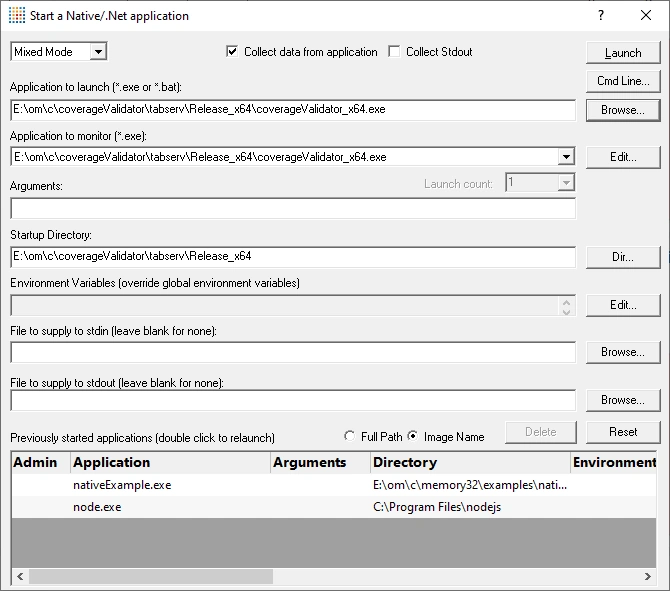
- Applications
- Applications launched from other applications
- Application launched from batch files
- Language and product extensions (JNI extensions to Java, Python extensions, AutoCAD arx extensions, etc)
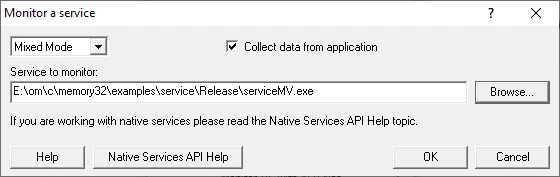
Services
.Net Services are supported.
Native Services are supported with the Software Verify Service API.
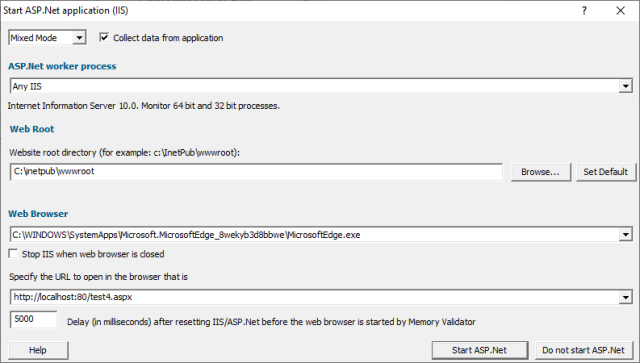
IIS and WDS
ASP.NET is supported.
ISAPI DLLs are supported with the Software Verify Service API.
Work the way you want
GUI
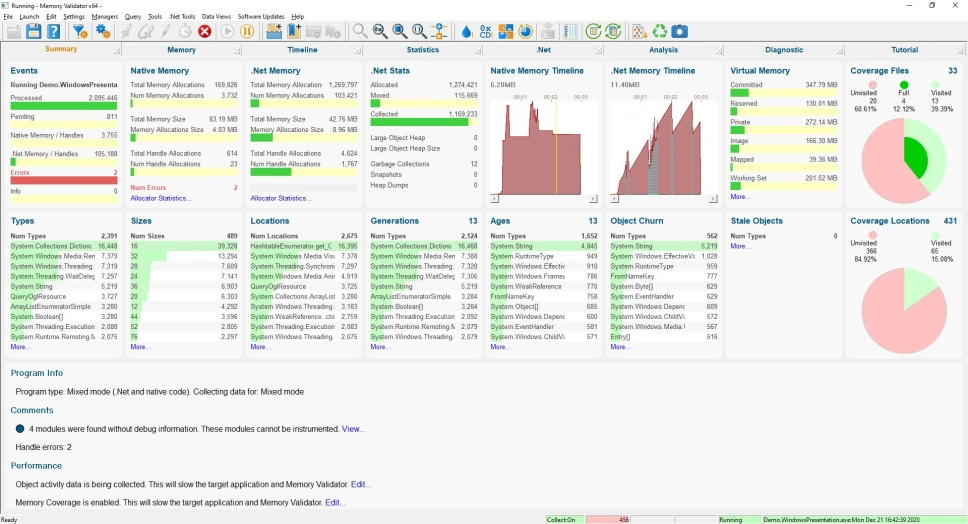
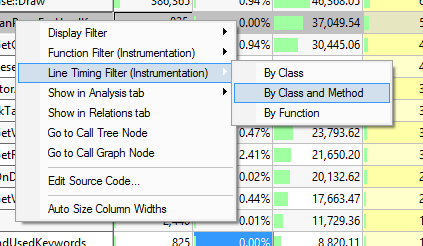
For an interactive exploration of the collected data, we provide multiple user interfaces to show different perspectives on the data.
Most user interfaces support context menus to allow you to filter the data, or change the perspective by displaying the data on another view.
Command Line / Automation
If you like to run automated tests, unit tests, regression tests, smoke tests etc., we have a command line that allows you to automate our software tools.
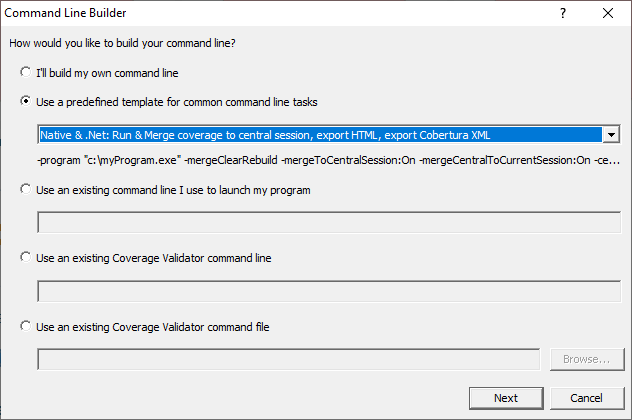
Don’t like writing command lines? We have that covered too.
Find any already launched program on the launch dialog, select it, the command line builder will automatically create your command line for you.
API (fit and forget)
You don’t need to use our API for most things, but if you choose to do so, you can fit it and forget it.
If your software using the API is installed on a computer without the Validator (for example, a customer machine) the API will do nothing.
This allows you to ship your development code with the API installed because it won’t do anything unless your software has been started from the Validator.
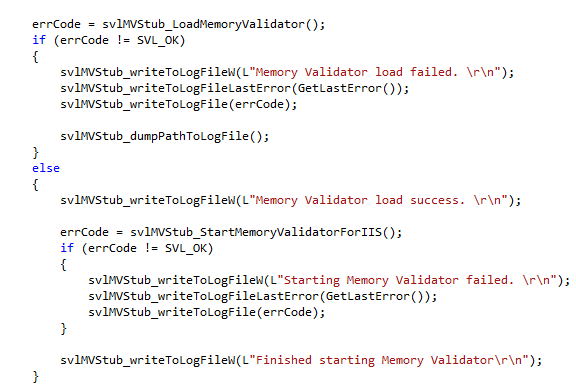
Only native services and IIS ISAPI need to use the API. For everything else, API use is optional.
Straightforward licensing
All our software licences are permanent – the licence lasts forever.
None of this run for one-year then buy the software again nonsense.
We provide the following types of licence:
- Non-floating licence. You need a licence for each user of the software.
- Floating licence with internet connection. This licence floats globally. Office, home, hotel, conference, coffee shop, beach. Your choice.
- Floating licence with no internet connection. This licence floats on your local network. Use this if you work in a security sensitive environment.
- Learn more about floating licences.
Software updates you can rely upon
Frequency
We release software updates on a frequent basis.
On average we release updates about every 2 weeks. Sometimes more frequently, other times less frequently. There is no fixed schedule – we release updates as fast as we reasonably can.
Communication
We’ll email you about each software update to ensure you know about it.
Our software update emails are just about the software, there is no marketing material in them – we know you don’t like that.
If you don’t want the software update emails, just let us know.
Automatic Software Updates
If you prefer the software to update itself you can setup automatic software updates, and schedule how frequently those happens.
Maintenance Period
For our free software tools, the tools will receive software updates automatically, forever.
For our commercial tools, the tools will receive software updates for 1 year from the date of purchase. Software maintenance can be renewed yearly.
Your favourite compilers and IDEs
We support your compiler / IDE, and support all Windows operating systems all the way back to Windows XP, including Windows Embedded.
- Native, .Net, .Net, mixed mode
- C, C++
- C#, C++.Net, F#, J#
- Visual Basic 6, VB.Net
- Delphi
- Fortran (95, 2003, 2008, 2018)
- Visual Studio
- C++ Builder
- Delphi
- Rad Studio
- Intel Performance compiler
- Qt Creator
- MinGW gcc / g++ compiler
- Clang / LLVM compiler
- Salford Software Fortran
- Compaq Fortran
Tools by debugging activity

Automated Build
Tools that can be run from the GUI or the command line that can automate your builds.
Automated Testing
Tools that can be run from the GUI or the command line, and that can be dropped into your smoke tests, regression tests, continuous integration tests.
Code Coverage
Tools for collecting, merging and comparing code coverage.
Memory Leaks
Tools for identifying memory, GDI and handle leaks, analysing memory usage, consumption, and page faults.
Performance Profiling
Tools for identifying slow functions, busy functions, slow locks, busy locks, time consuming waits, and page faults.
Deadlock Detection
Tools for analysing threading behaviour, automatically finding locking errors and for analysing your source for common thread locking mistakes.
Execution Tracing
Tools for showing the "How did I get there from here?". A black box recorder for your software.
Debug Information
Tools to allow you to inspect the debug information for your software
Minidumps
Tools for creating, inspecting and visualising minidumps and event logs.
Visual Studio
Tools for automating Visual Studio. Tools for fixing problems with Visual Studio projects.
Mistake Detection
Tools for detecting mistakes that tired and busy software engineers make.
Developer Tool Suites
Collections of our main software tools providing better value for money.One Tool For Each Job
We think software tools should concentrate on one job at a time. Your memory leak tool should be all about memory issues – it shouldn’t be trying to be a performance profiler and a deadlock detector at the same time.
The right tool for each job.
If you develop for Windows and use Visual Studio, C++ Builder, Delphi, QtCreator, MingW we have tools to help you. They can help you to find and fix bugs in C, C++, Delphi, Fortran, Visual Basic, C# and VB.Net.
We’ve helped thousands of software developers find, fix, and prevent bugs.
For 22 years we’ve been providing tools to tackle the biggest problems out there: our happy customers include giants like Adobe, Cisco, Intel, UBS, and HP.
Testimonials
Recent News
Potential misleading digitial signature warning with automatic updates
If you’ve installed any of our commercial tools (not evaluation versions) before January 26 2024, then enabled automatic updates and tried to update your software […]
How do I build all configurations of a project from the command line?
The problem I needed an easy way to automate the building of a Visual Studio project from the command line. It needed to work regardless […]
Loading Validator into a process
Everything written here applies to all Validators: Bug, Coverage, Memory, Performance and Thread. There are many ways to start collecting data with a Validator: Launch, […]
How to submit bug reports
Bugs are an unfortunate part of being a software developer. Sooner or later you’re going to bump into one and need to ask the vendor […]
How we provide customer support
In this article I’m going to explain how we provide customer support. Free Customer support is free. There is no charge for customer support. Customer […]