C# and C++ memory leak detector - Memory Validator 9.93
Having problems collecting data about your memory and handle allocations?
Fed up with using leak detectors that have collected data about the program, but you then can’t query that data properly?
We had the same problem when we were working on a 2 million line CAD program, trying to make existing memory leak detectors work with it.
We wrote Memory Validator to allow us to identify leaks other tools couldn’t find and to understand and fix memory corruptions that can’t be understood with traditional approaches. The initial goal was to monitor 1,000,000 allocations, display all the callstacks for those allocations then monitor all the deallocations. 20 years later, some of our customers now process billions of events per session with Memory Validator. You can too!
4 Minute Video
Find memory leaks quickly and easily with Memory Validator.
Memory Validator is a memory leak detector for use by software developers, software quality assurance testers and customer support staff using .Net, .Net Core (C#, VB.Net, etc) and native language compilers (C, C++, Delphi, VB6, Fortran etc).
Use Memory Validator to:
- Monitor billions of allocations in your application.
- Detect memory leaks and handle leaks (GDI leaks, etc).
- Find memory and handle leaks in native, .Net and mixed-mode .Net applications.
- Find double deletes, double frees, calls to deleted objects and related memory errors.
- Find uninitialized memory in C++ objects.
- Automatically detect memory leaks using the command line API. (For use with Jenkins, etc).
- Improve your unit tests, smoke tests and regression tests by automatically adding memory leak support to the tests.
Drowning in data, where do I start?
A common problem when monitoring applications that allocate a lot of memory and handles is understanding what is happening.
You need to be able to get a handle on which statistics need further investigation without having to visit many different displays.
To make this easy, we’ve provided a summary display highlighting all the key statistics, from which you can easily jump to a display dedicated to that statistic.
You can split the dedicated displays several ways, splitting along the .Net/native divide, but we don’t think that provides a useful experience. Because of this, in some places, you’ll find data of just one type (say .Net), but in others, you’ll find .Net and native data side by side (for example, when looking at type and size statistics) because that makes more sense.
Summary
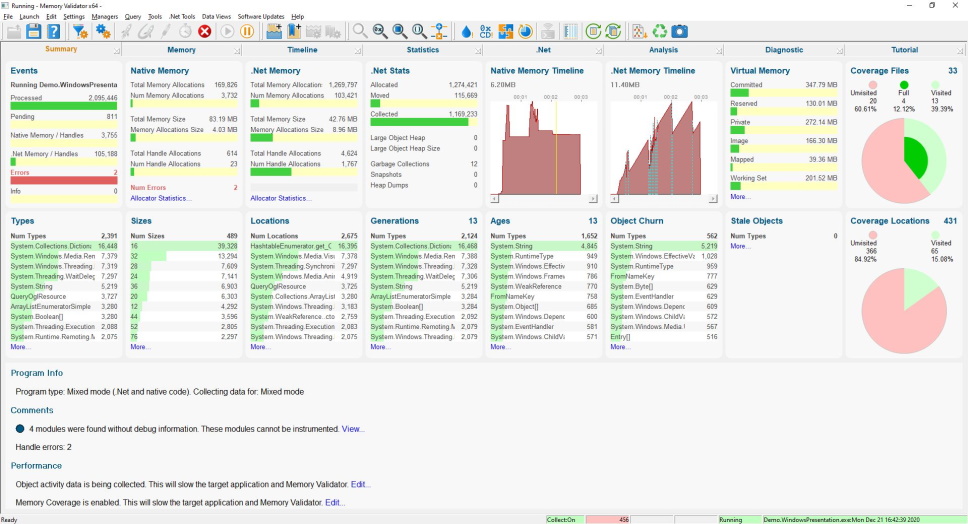
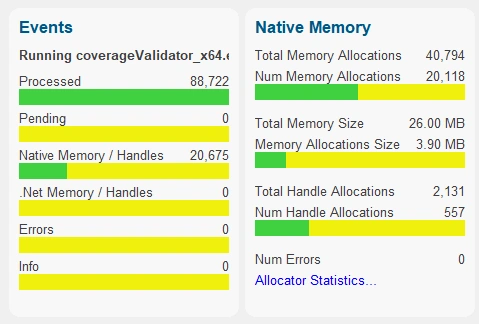
The Summary view provides a high level summary of all the key memory allocation statistics in the target application.
Dedicated panels provide information in graphical and numeric form for a particular statistic group.
A commentary panel also provides additional information that can’t be provided as graphics and numbers. All status information is displayed on the diagnostic tab, but some important errors are also reported on the commentary panel.
Each panel in the display can be used as a jumping-off point to more detailed statistics. Click any bar graph or hyperlink to go to the appropriate display with detailed statistics.
The configuration of the summary panel adapts to the application being profiled. .Net applications just show .Net stats. Native applications just show native stats. Mixed-mode applications show both .Net and native stats.
Memory
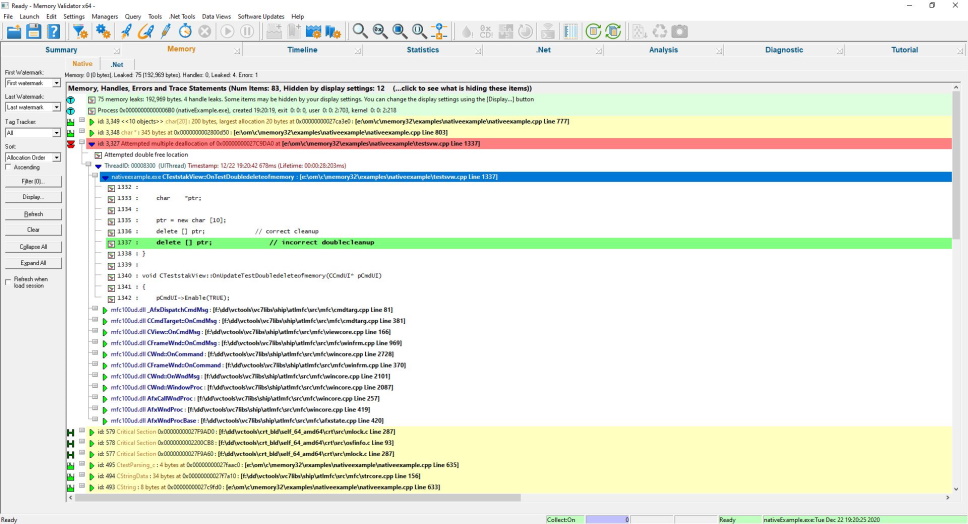
The memory view displays memory leaks, handle leaks, informational messages and error messages. This display can also be used to view allocated memory and handles while an application is running.
Native allocations are shown on one sub-tab and .Net allocations on another sub-tab.
You can drill down to the source code and edit the source code in a context-sensitive colourised editor or in Microsoft® Visual Studio® or an editor of your choice.
Filtering
A wide variety of memory allocators and handle allocators can result in their allocations being shown on this display.
To keep this manageable, options are available to control the display of each group of allocators.
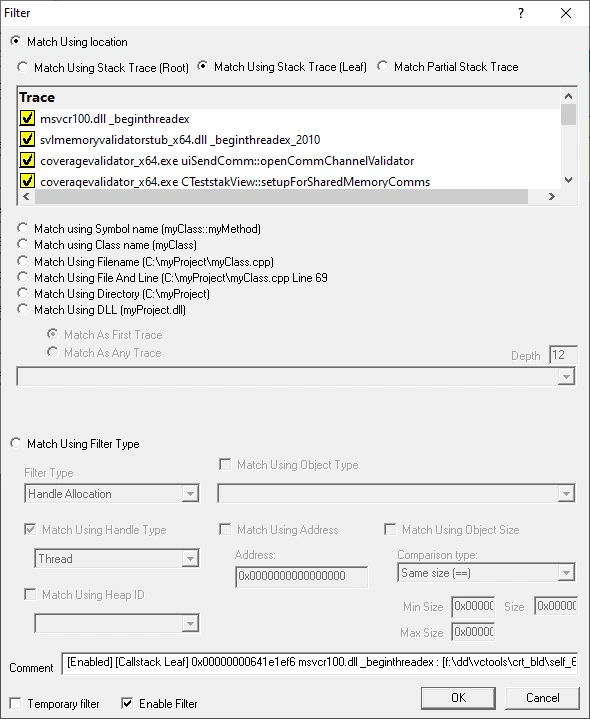
Powerful, flexible filtering allows you to display only the data you want, or hide unwanted data, using criteria such as callstack, DLL, filename, object type, etc.
Additional filtering using watermarks allowing you to restrict the data display to a region of execution.
Finally, tag trackers allow you to filter data that has been annotated at runtime with tags of your choice.
Timeline
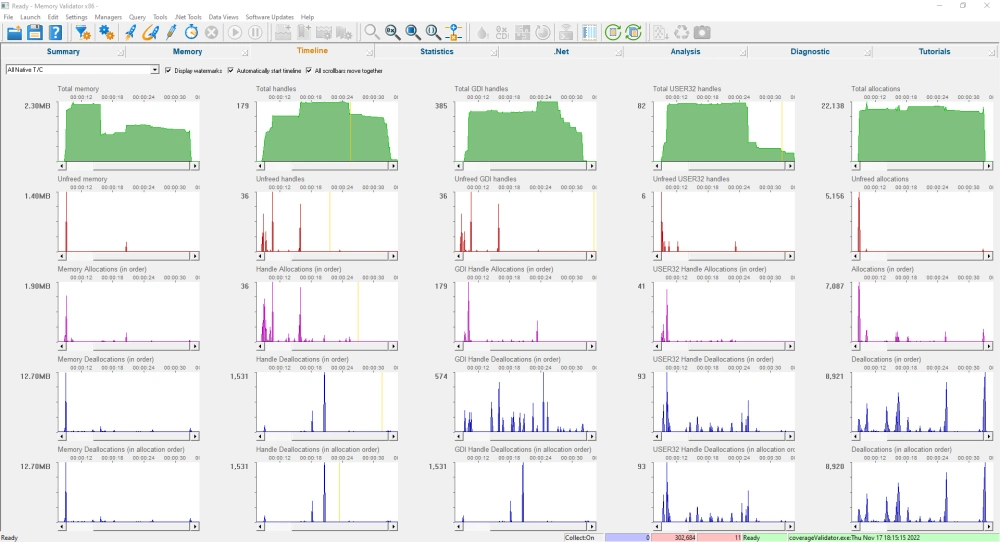
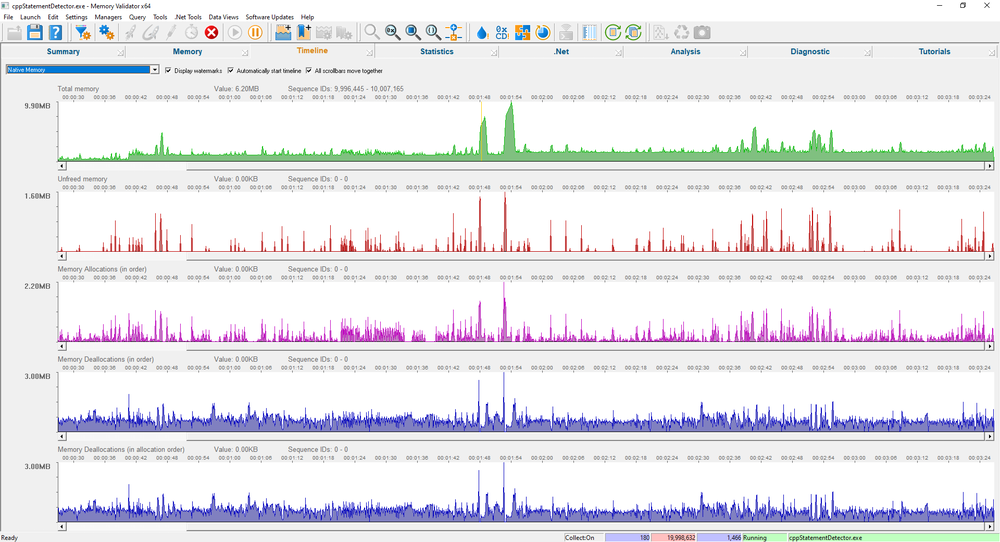
The timeline view shows timelines depicting memory usage, unfreed memory, memory allocations, memory deallocations (in order) and memory deallocations (in allocation order). There are 25 different timeline displays to choose from, which display between 5 and 40 timeline graphs, giving you a great deal of choice over what data you monitor.
This data is shown for memory, for handles and for the number of allocations, for both native and .Net allocations
Seeing the different allocator behaviours graphically allows you to identify patterns in your memory allocation behaviour where you may want or need to make a change to release memory earlier, or to change how memory is managed.
Visualizing these patterns helps to reveal them, hence this view.
Memory questions
Using the timeline, you can answer these memory questions.
- Is memory increasing and never decreasing? A memory leak?
- Is memory being deallocated in the same order it was allocated?
- Is memory being deallocated in the reverse order it was allocated?
- Is memory being deallocated randomly compared to how it was allocated?
The answer to these questions could help you identify memory management patterns that result in slower memory performance or, worse, memory fragmentation.
Handle questions
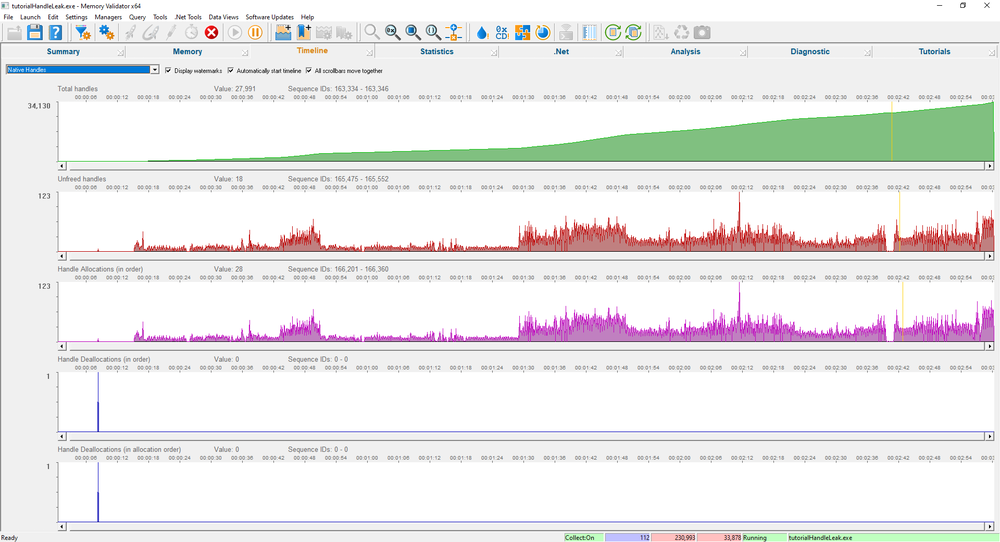
Using the timeline, you can answer these handle questions.
- Are handles increasing and never decreasing? A handle leak?
- Are many handles being allocated before being deallocated?
- Are many handles being deallocated shortly after being allocated?
- Are handles deallocated in the same order as they are allocated?
These are useful questions to be able to ask, as anyone that has used FindFirstFile/FindNextFile but only closed the handles at the end of the search will have found out (very slow! For best results, close them as each directory search completes).
Statistics
The Statistics display provides five different statistics about memory and handle allocations.
- Types, where you can view data about object types and their lifetime.
- Sizes, where you can view data about allocation sizes and their lifetime.
- Locations, where you can view data about allocation locations and their lifetime.
- Generations, where you can view data about .Net types and the number per generation.
- Ages, where you can view data about .Net types and the age of these objects.
Types
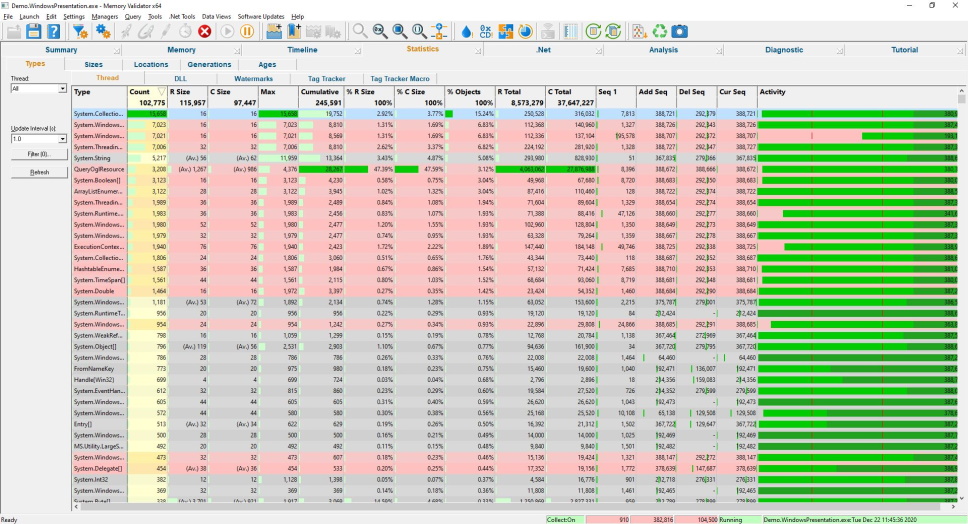
The types view shows statistics describing the different types of object that have been allocated, reallocated and deallocated.
The display shows all types of object whether they are memory or handle, native or .Net.
Data is displayed about each object type, size, the number of objects of that type currently in use and the total memory consumed by these objects plus indications of when the object was first used, most recently allocated, most recently deleted and lifetime activity.
Sizes
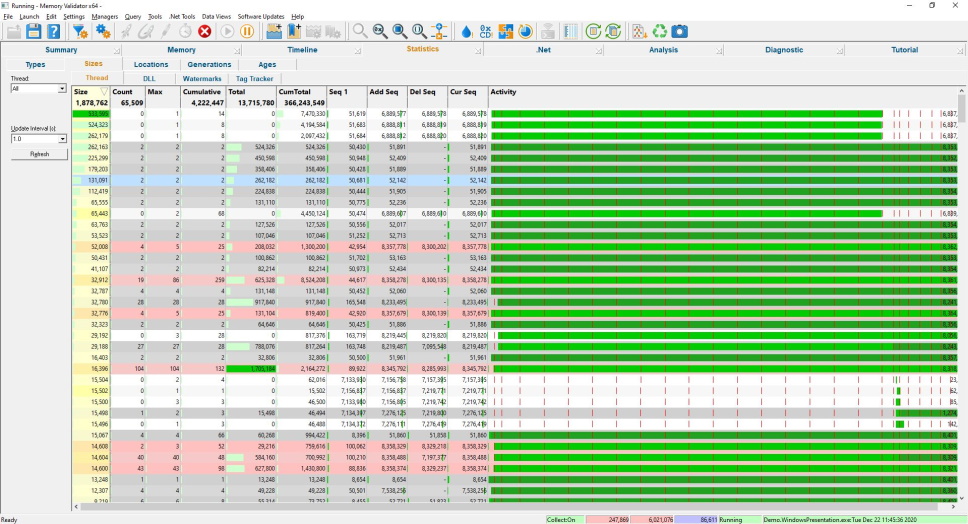
The sizes view shows statistics describing the different size of allocations that have been allocated, reallocated and deallocated.
The display shows all sizes of allocation whether they are memory or handle, native or .Net.
Data is displayed about each allocation size, the number of allocations of that size currently in use and the total memory consumed by these objects plus indications of when the allocation was first used, most recently allocated, most recently deleted and lifetime activity.
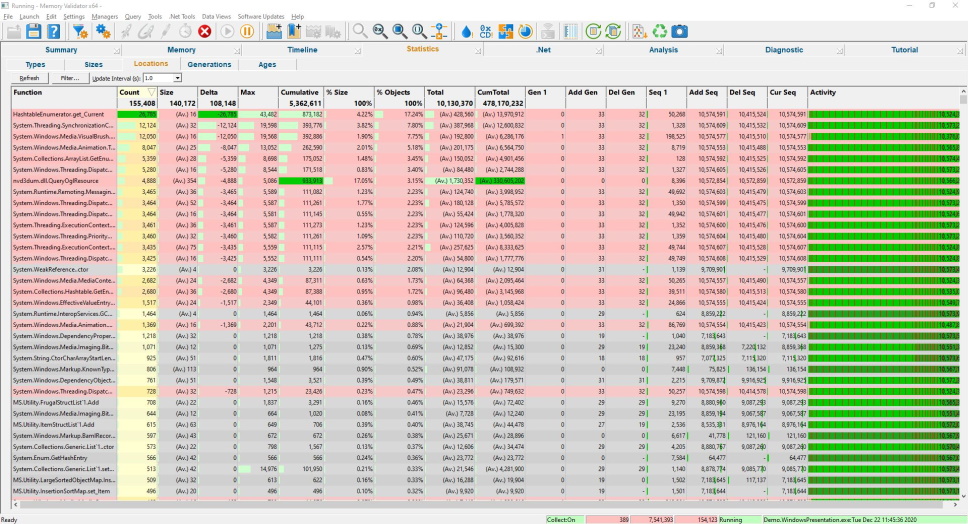
Locations
The locations view shows statistics describing the different locations (filename and line) for each allocation (also reallocation and deallocation for native code).
The display shows all locations of allocations whether they are memory or handle, native or .Net.
Data is displayed about each allocation location, the number of allocations of that size currently in use and the total memory consumed by these objects plus indications of when the allocation was first used, most recently allocated, most recently deleted and lifetime activity.
For .Net objects the context menu provides the ability to show all paths to root, or all paths from root for a given allocation location.
Generations
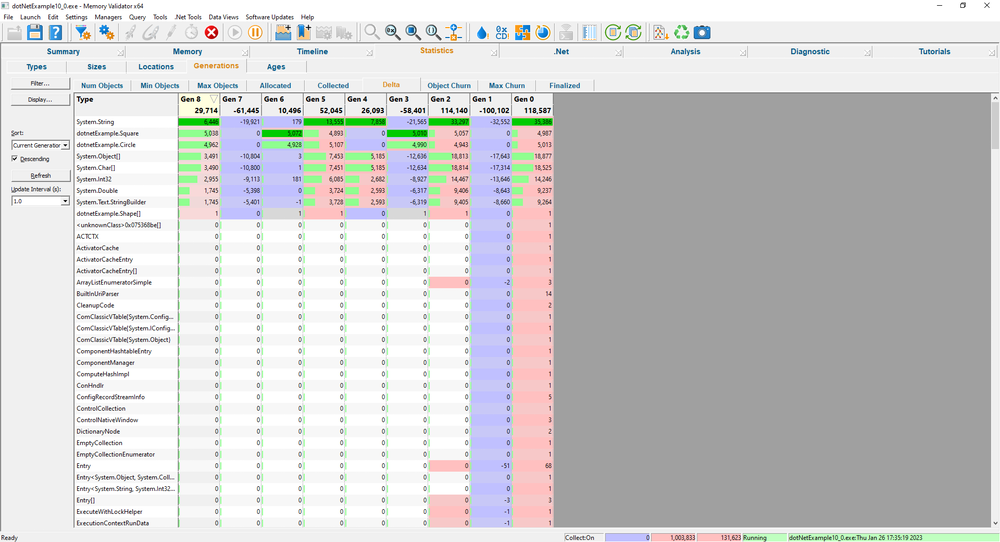
The Generations View displays the number of objects per object type for each generation of objects that the application has allocated.
A generation is considered to be the objects allocated between one garbage collection event and the next garbage collection event.
The display is colour coded so that increases and decreases in objects are easily seen. The colour coding allows you to quickly identify object types that are not being deallocated as generations progress.
The display can be filtered by object type, allowing you to focus on the types of interest to you.
Statistics per generation
For each generation, the following statistics are available:
- Number of objects.
- Minimum number of objects.
- Maximum number of objects.
- How many objects were allocated.
- How many objects were collected.
- Delta. Difference between allocated and collected.
- Object churn. Ratio of objects being collected to total.
- Maximum object churn.
- How many objects were finalized.
What may indicate a leak?
- Number of objects always increasing.
- No objects being collected when objects are being allocated.
- Delta is positive.
Ages
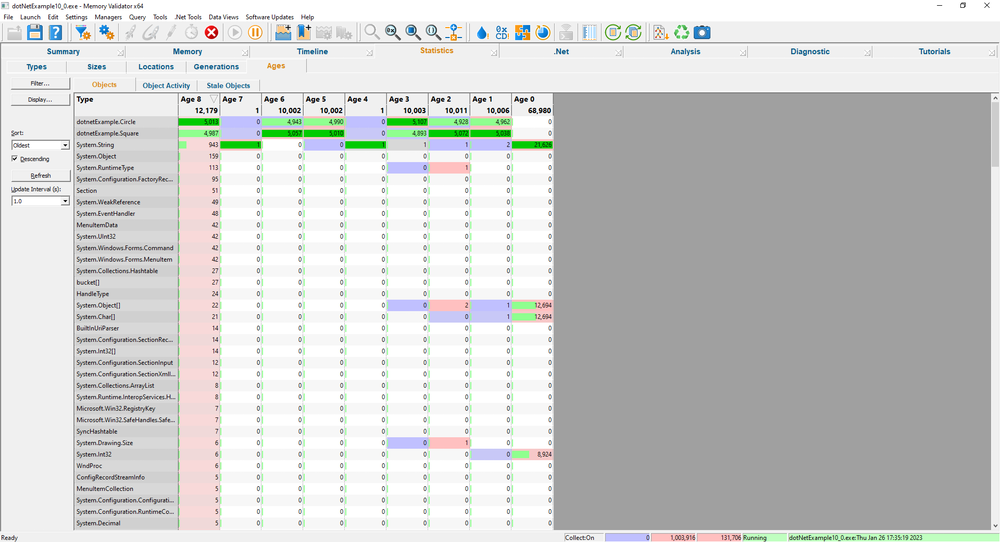
The Ages view shows you the lifetimes of objects in your application.
For each object type, the Ages View displays the number of objects of a given age per object type that have survived a garbage collection.
This is not to be confused with the generations display which displays the number of objects of each type that have survived a garbage collection.
How long should an object live?
The memory allocation profile of most applications is that a few objects are long-lived (typically allocated during application startup), and the remainder of the objects are short-lived.
Using this information, you can spot potential memory leaks by identifying objects that live longer than expected.
In the image to the right, you can see that both dotnetExample.Square and dotnetExample.Circle have objects of age 1, 2, 3, 5, 6, 8.
Is this deliberate application behaviour or an unintended memory leak?
.Net and .Net Core
In addition to the Generations and Ages data on the statistics tab, there are also three dedicated displays for .Net data.
- Memory Snapshots, where you can create and compare snapshots to find data you didn’t expect to exist.
- Heap Dumps, where you can find the path from an object to its roots, preventing it from being garbage collected.
- Leak Analysis, where you can run predefined queries and create custom queries to detect leaking .Net objects.
.Net Snapshots
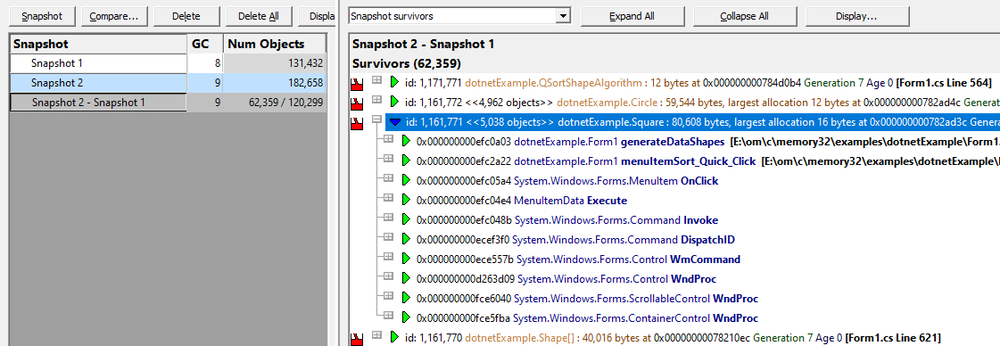
The Snapshots View displays the contents of any memory snapshots and snapshot comparisons that have been created.
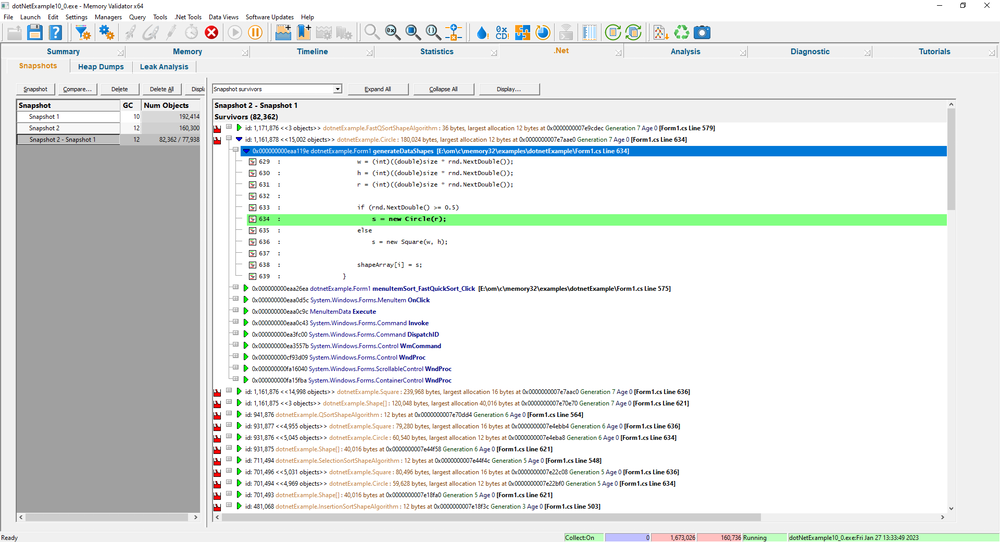
Data in any memory snapshot comparison can be inspected to show the unique callstacks for each object type in the memory snapshot comparison. An integrated source code view displays the source code for each location in a callstack.
Memory snapshots can be compared, showing the difference between two memory snapshots. This allows you to identify objects that were created between two snapshots and which have not been collected by the garbage collector. Objects which should not have survived the second garbage collection can be considered to be memory leaks.
Objects allocated on callstacks that have previously allocated objects that have been collected are highlighted in green. This is a hint that the garbage collector has collected similar objects before.
The display can be simplified by finding grouping objects allocated on the same callstack as other objects so that you can see one callstack with a count next to it rather than see many duplicate callstacks.
Consider the image to the right, the expanded entry has a high object count and is not coloured green, indicating that none of the objects allocated on this callstack has ever been garbage collected.
Is this the location of a .Net memory leak?
.Net Heap Dump
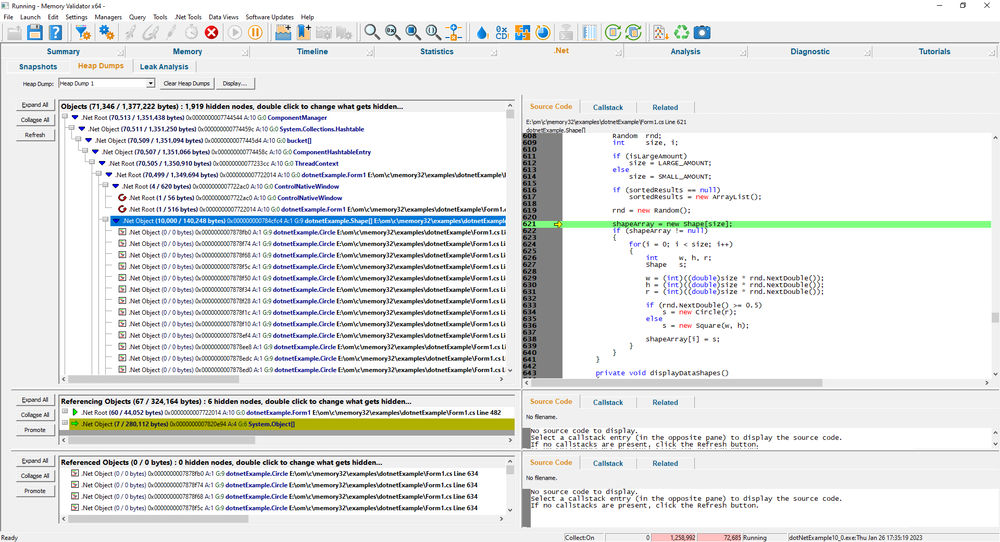
The Heap Dump View allows you to determine which .Net objects are referenced by another object.
When investigating .Net memory leaks it is important to know which objects reference each other to determine the object that is holding a reference that is no longer required.
The heap dump can be displayed as a full heap dump and as a simplified heap dump.
A full heap dump shows every node in the heap dump.
A simplified heap dump shows all the interesting nodes and none of the nodes that have no impact on .Net memory leaks. This makes the heap dump easier to understand as there is less data to examine.
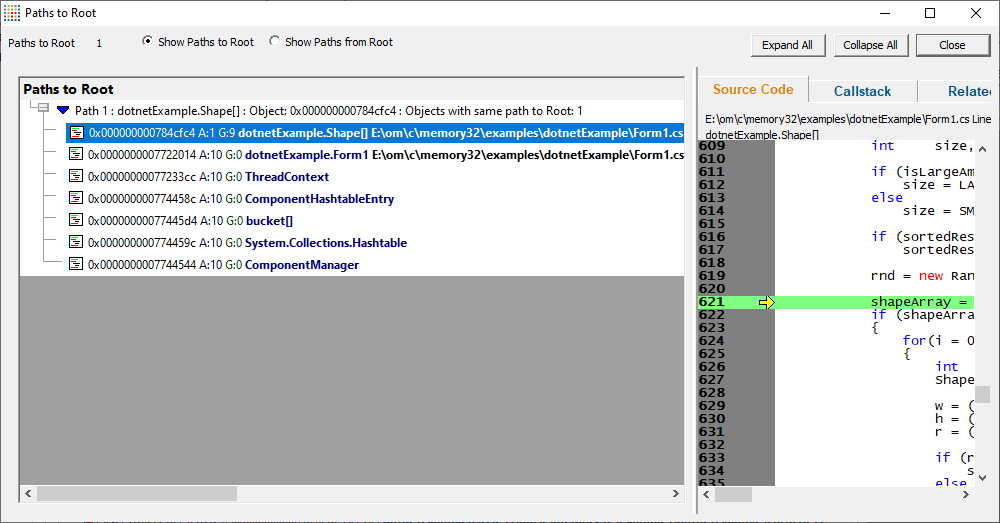
A context menu on every heap dump node gives you access to a wealth of options, including the Paths to Root dialog, which allows you to easily see the references that are preventing this object from being garbage collected.
.Net Leak Analysis
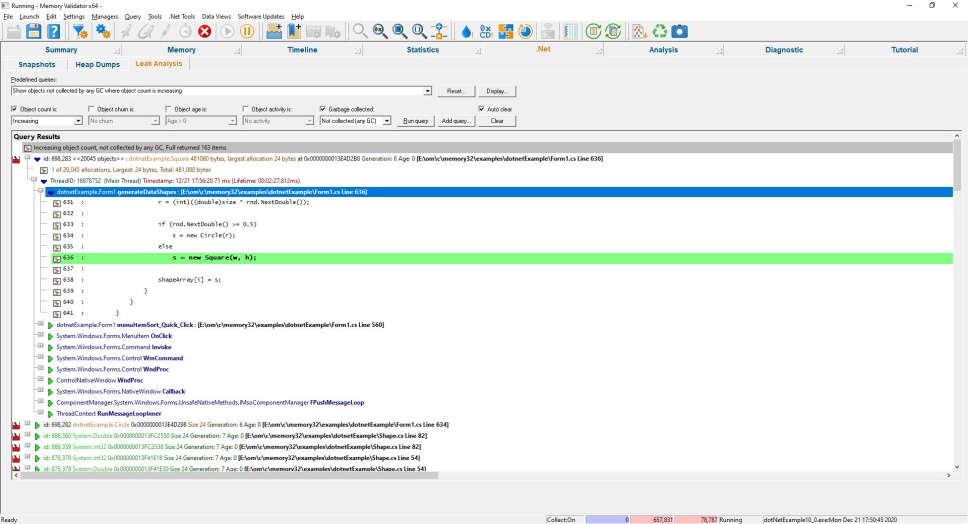
Memory Validator collects a lot of data. Some of it is about native allocations, some of it is about .Net allocations, and the remainder is housekeeping and diagnostic data.
We try to provide useful user interfaces to allow you to query this data to surface answers to the problems you are trying to solve.
As hard as we try, there are probably occasions when you really need to be able to run a query and rummage through the results.
That’s where the .Net Leak Analysis comes in. You can specify up to 5 criteria for the query. Any object that matches the query is part of the query results.
Run as many queries as you want, clear them, change the queries, and repeat.
Using the query results, you can go to the appropriate Heap Dump location or be shown paths to the heap dump root or paths from the heap dump root.
Predefined queries
It can be time-consuming and tedious to have to reconfigure common queries. Because of this, we’ve provided 18 predefined queries that you can choose from.
Custom queries
If you have custom queries that you would like to run you can add your queries to the list of predefined queries for future use.
Memory Analysis
Memory Analysis provides you with five more displays to provide insight into the data you have collected.
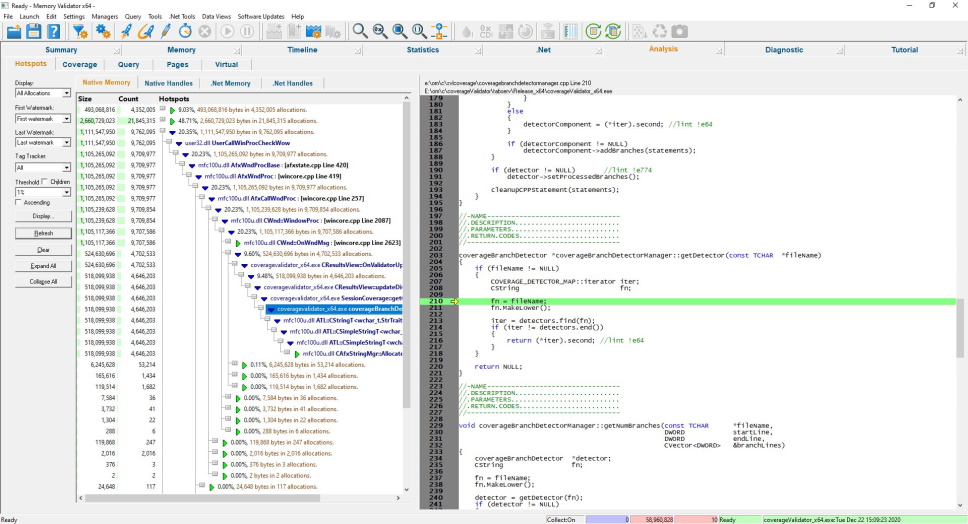
- Memory Hotspots, where you can identify the places that allocate, reallocate or deallocate the most data.
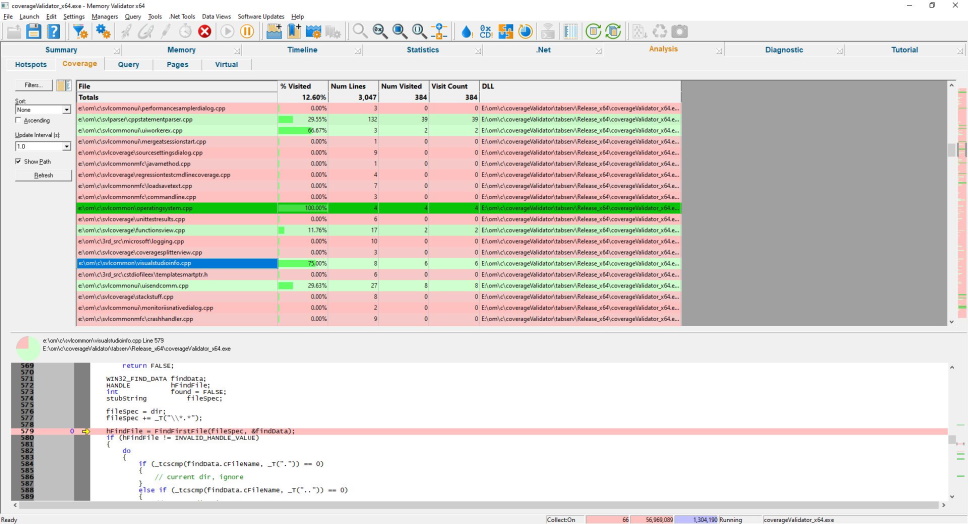
- Memory Coverage, where you can check that all allocation, reallocation and deallocation locations are visited.
- Native Leak Analysis, where you can run custom queries about native memory leaks.
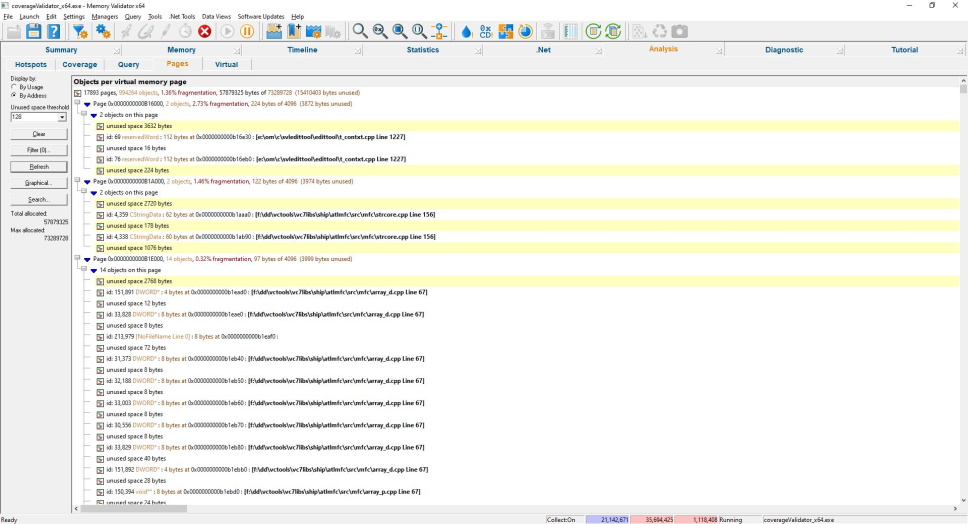
- Memory Pages, where you can see which memory allocations are adjacent to each other and the space between allocations.
- Virtual Memory, where you can examine the virtual memory layout of your application.
Memory Hotspots
Your program may not leak memory, but you may have parts of your program that allocate more memory than you realize.
By identifying such areas, you can focus on managing these allocations in a more structured way. You can reduce the amount of time your program spends in the heap manager, reduce memory fragmentation, and increase the speed at which your program executes.
Memory Coverage
If you are testing your application’s memory allocation usage, you need to know that all the places in your application that allocate and deallocate memory have been visited.
The memory coverage analyzer provides this facility for memory and handles for both native and .Net code.
Filtering
Filters allow you to remove third-party files from the display.
Auto merge
Auto merge facilities allow you to merge coverage statistics from multiple runs to form a composite coverage value for your regression test suite.
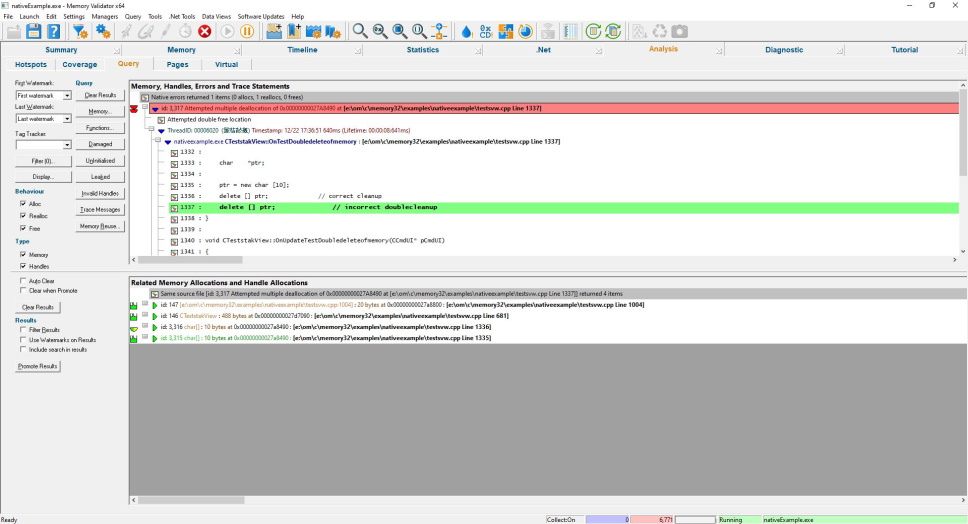
Memory Query
When tracking down the source of a memory leak, memory corruption or a crash, you may want to query the data held by your memory leak tool. Most tools don’t let you do this. The Memory Query view provides a dedicated query interface to query for leaked objects, damaged objects, invalid handles, uninitialised data and find data based on its size, address, page, file, DLL, heap, function name or filename.
Once the data is found, it can be filtered, and data related to any selected item can be shown in the lower window. Data in the lower window can then be promoted to the upper window so that the same tests can be performed on this data. Using this iterative process, it is possible to find references to ‘dead’ objects, objects pointing to a specific object, objects pointed to by a specific object, and so on.
You’ll be surprised by what useful information you can find when starting with a crash address and querying it (or an address near it).
Pages
This view provides a page-by-page account of memory page usage and memory page fragmentation. It lists each allocation that is allocated on a memory page.
The yellow lines are sandbars, indicating unused memory greater than a specified threshold value. Sandbars are displayed when the Pages view is in Address mode.
Virtual Memory
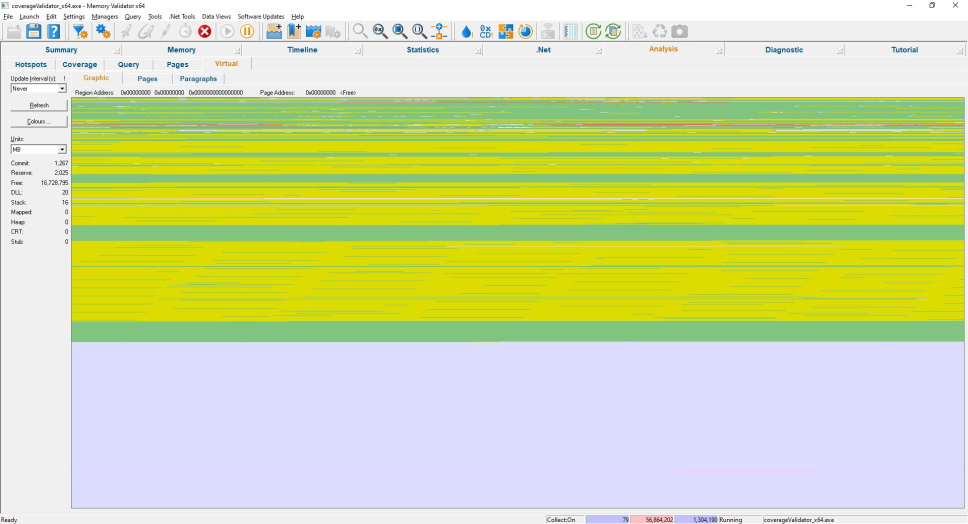
The Virtual Memory section provides three different views of virtual memory, an image representation and two tabular representations, one for virtual memory page sizes, and one for virtual memory minimum allocation sizes (minimum size VirtualAlloc() can allocate).
Setting the display to update automatically can be useful for watching large data models load into or unload from the target process and watching the memory usage, detecting fragmentation and so on. Alternatively, if you wish to refer to some data on the display you may want to only refresh the data manually, allowing you to decide when the data you are reading changes.
Graphical
This is a graphical representation of virtual memory.
The different colours represent the different memory commit states for each page, 1 page per pixel. As the mouse is moved over the display area, the size and address of the region the mouse cursor represents are shown at the top of the display.
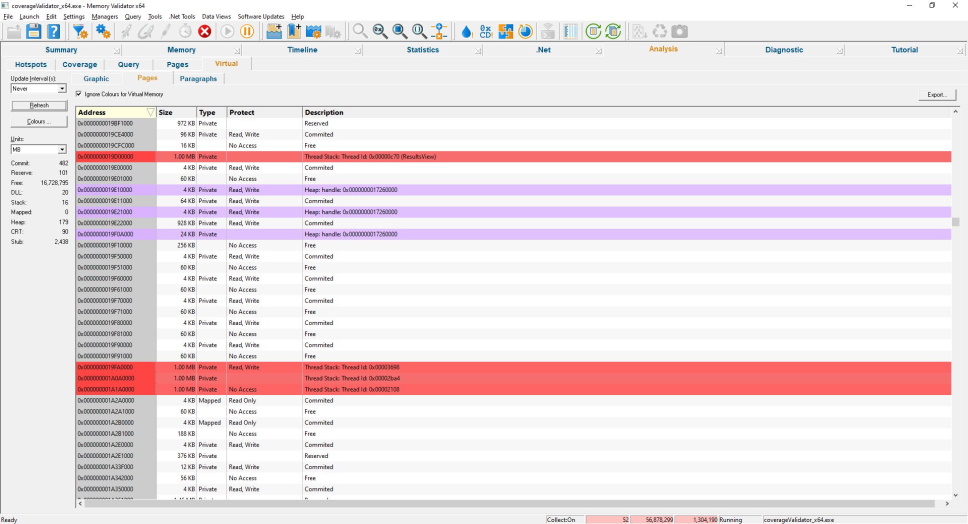
Virtual Memory Pages
The virtual memory status for each virtual memory page (4KB – the granularity for VirtualProtect()).
Note the thread stacks in red and Win32 heaps (HeapCreate()) in purple.
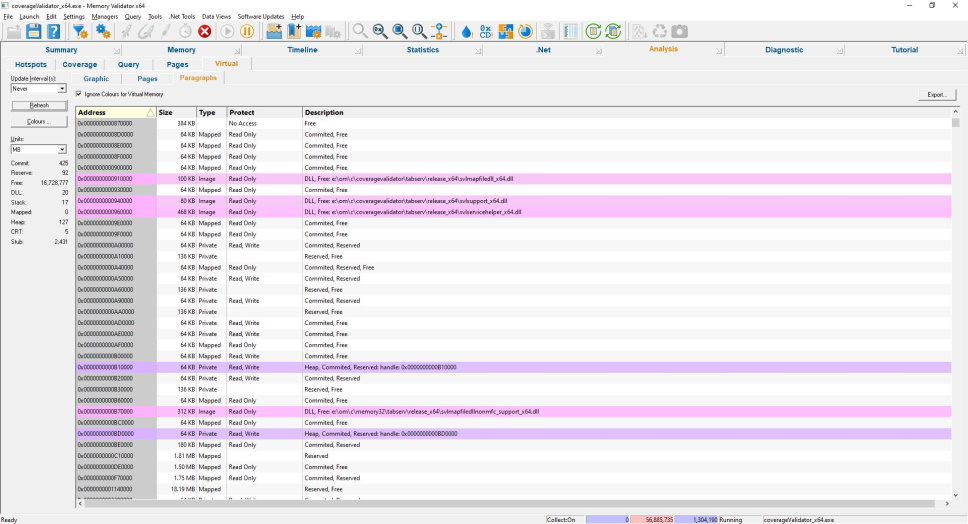
Virtual Memory Paragraphs
The virtual memory status for each virtual memory paragraph (64KB – the allocation granularity for VirtualAlloc()).
Note the Win32 heaps (HeapCreate()) in purple and DLLs in pink.
Diagnostics
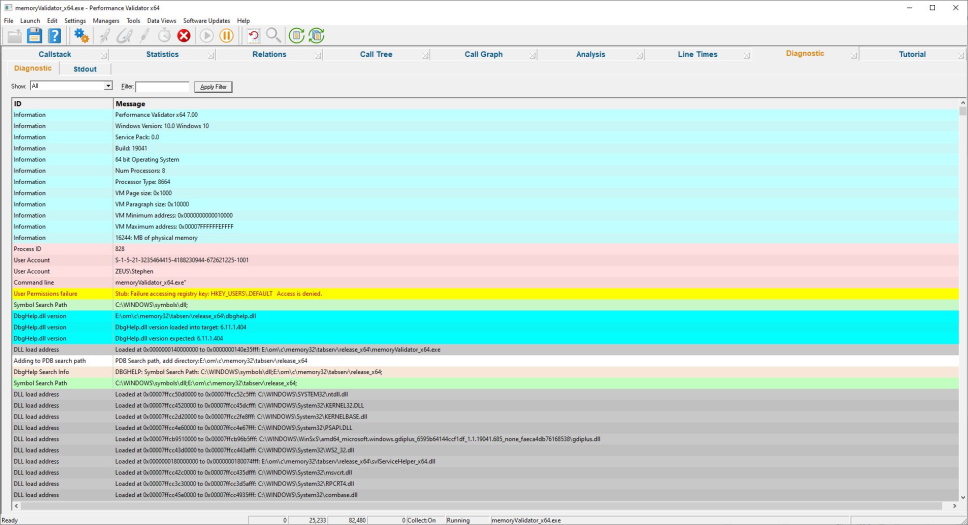
The diagnostic display informs you of any information that you need to know which may affect the performance of Memory Validator.
- DLL load address
- Symbol information search/load/success/failure
- Instrumentation success and failure
- Disassembly of troublesome code
- Misc diagnostic info
- Env vars
- Stdout/Stderr
Get to work in minutes
You don’t need to modify your application, recompile your software or relink your application.
Just launch your application from Memory Validator and start collecting memory and handle allocation data immediately.
Memory Validator uses your software’s debug information to perform the instrumentation of your software. Supported debug formats are PDB, TDS, DWARF, STABS, and COFF. We can also use MAP files if line number information is present.
Working with a service or IIS/ISAPI?
You don’t need to modify your software unless you are writing a service or working with IIS.
If you’re working with a service or IIS there is a simple API you can use that you can “fit and forget”. It’s so easy to use you can leave the API linked into your release product – it will do nothing unless Memory Validator is present.
4 step memory leak detection
This simple 4-step process is how you detect memory leaks with Memory Validator.
- Launch your application with Memory Validator.
- Run your application as normal.
- Close your application.
- Examine the memory leaks that Memory Validator finds in your software.
Easy-to-read data displays show you all the errors in the order they occurred. The displays can be filtered to show you only the information that you want to work with.

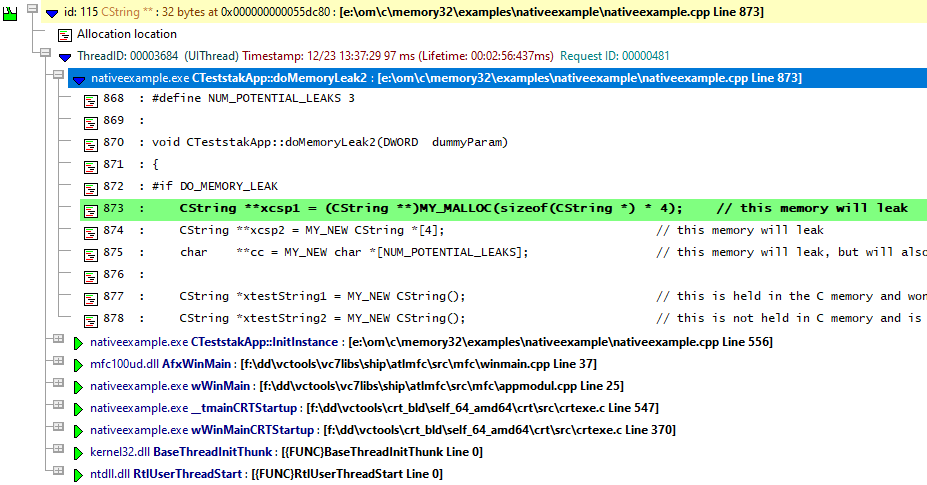
Drill down to the data in the displays by expanding an entry in the display to display information about the memory leak: What type of object was allocated, what size, where (address, filename, line number<), thread id, allocation timestamp, lifetime and sequence id. Also displayed is a comprehensive callstack showing each class and method name, filename and line number. Each entry can be expanded to display the source code for that line.
GDI Handles
It’s not uncommon for GDI handle leaks to occur in code related to drawing images. Leak too many of these, and nothing will display properly.
GDI handles are reported with extra data relating to the type of GDI handle. Pens and brushes indicate their colour and the type of line or brush (solid, pattern etc.). Fonts indicate the font construction, and bitmaps indicate information about the bitmap. Often this information is enough for you to identify the handle before you even dig into the code.

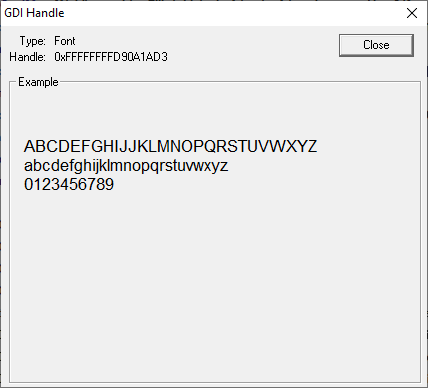
Perhaps you’d like to see what the GDI handle looks like while your application runs. Not a problem – select the GDI handle on the Memory View, display the context menu and choose Show GDI Object… The GDI handle is shown in its own dedicated dialog. Here’s the font GDI handle from the callstack shown above.
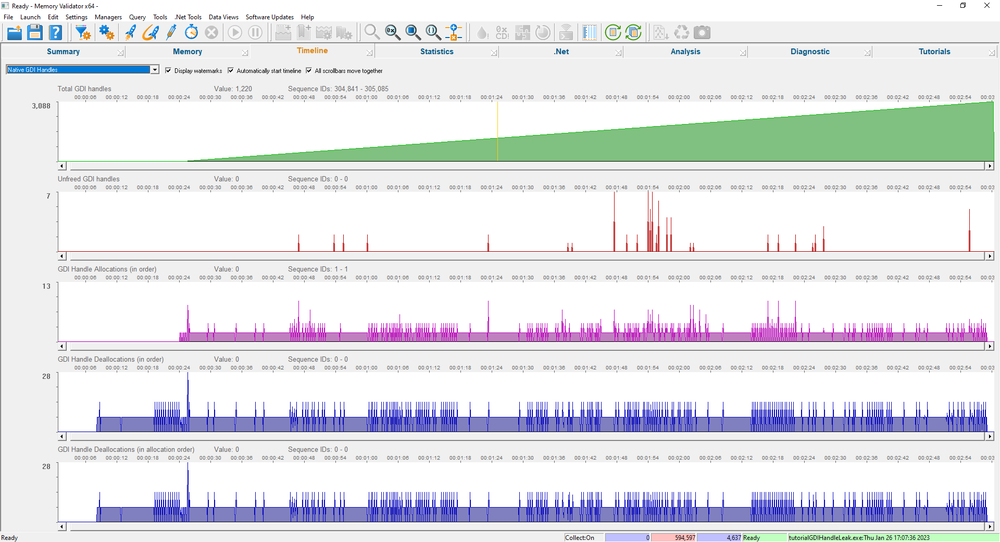
It’s only natural that you’d want to be able to monitor GDI handles and User32 handles changing over time, which is why the timeline display provides dedicated timelines for GDI handles and User32 handles.
Watermarks
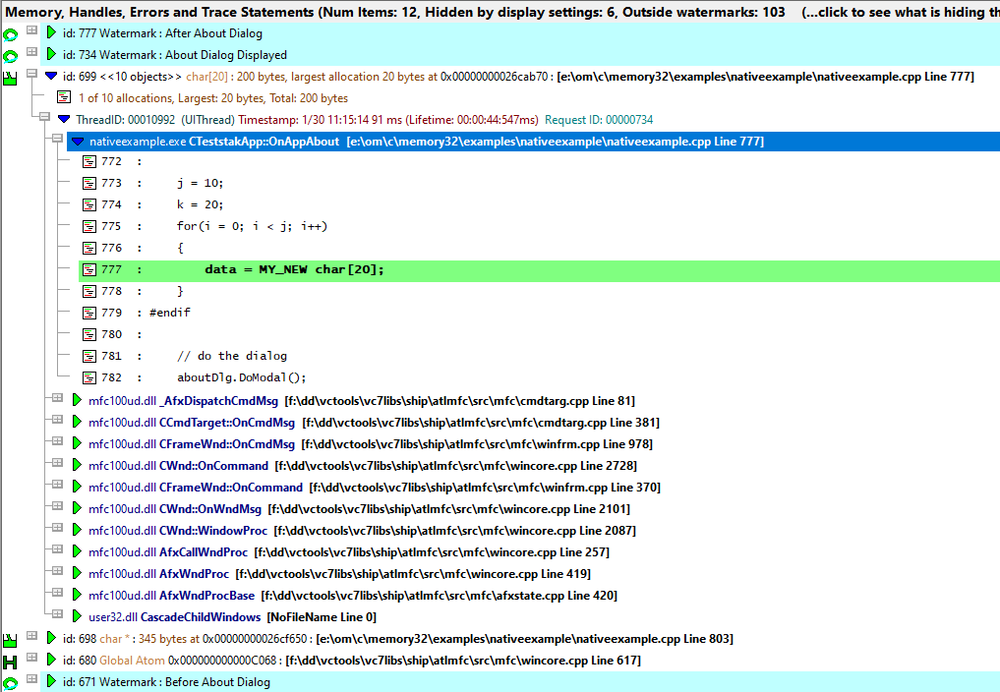
Watermarks allow you to identify points in the sequence of memory allocation events. Once you have two or more watermarks, you can filter the display only to show you data allocated between two of those points. This can be very useful for detecting if the number of objects allocated (and not deallocated) between two points is what you expected. Watermarks can be named, allowing you to use meaningful names for each watermark.
For example, imagine creating a boss in a 3D program, then putting a chamfer onto the boss and then deleting the boss. If, after the deletion, you still see the allocated boss and the allocated chamfer, you probably have a memory leak. Seeing these allocations among all the allocations at runtime is hard work. But if you place a watermark before the creation of the boss (named “beforeCreateBoss”) and another watermark after the deletion of the boss (named “afterDeleteBoss”), you can then change the watermark filters to the before and after watermarks and view the allocations between those watermarks. This allows you to interactively test features of your application and check expected application behaviour as you test.
If you’d rather place watermarks programmatically, we have an API for this. One of our customers uses this API to place watermarks around all their database transactions allowing them to determine very easily which transactions leak and which transactions don’t leak.
Tag Trackers
Tag trackers are a very useful tool that allows you to classify different allocations as part of a related unit. For example, you could classify a lion, a tiger and a cheetah as “big cats” and classify a wolf, a husky and a fox as “canids”. How useful would it be to view statistics on related groups of allocations as well as just statistics on allocations?
This is best explained with a simple code example.
   createAFish("Pike");                   // no tracker

   {
      svlDataTracker   tracker_cats("Cats");

      createAnAnimal("Lion");             // cats tracker
      createAnAnimal("Tiger");            // cats tracker
      createAnAnimal("Panther");          // cats tracker

      {
         svlDataTracker   tracker_flowers("Flowers");

         createAFlower("Daffodil");       // flowers tracker
         createAFlower("Rose");           // flowers tracker

         {
            svlDataTracker   tracker_trees("Trees");

            createATree("Oak");           // trees tracker
            createATree("Sycamore");      // trees tracker
            createATree("Ash");           // trees tracker
            createATree("Horse Chestnut");// trees tracker
         }

         createAFlower("Lily");           // flowers tracker
      }

      createAnAnimal("Leopard");          // cats tracker
      createAnAnimal("Cheetah");          // cats tracker
      createAnAnimal("Cougar");           // cats tracker
   }

   createAFish("Salmon");                 // no tracker
Data that has been classified with tag trackers can be viewed on the Memory, Statistics, Hotspots and Memory Query views, providing you with opportunities to drill down into the data.
![]()
Configurable
Memory Validator can be configured to collect all data or just the data you need. Powerful filters for collecting data and for displaying collected data give you maximum flexibility and control over how much CPU time is spent and how much memory is used collecting data allowing you to choose how much effort is put into a given task.
The default options of Memory Validator concentrate on all memory leak types for C, C++, Delphi and Fortran, plus Win32 handles. You can enable/disable leak detection by memory type (for example, HeapAlloc) or handle type if you wish only to track specific types of memory or handle leaks.
Additional capabilities include uninitialised data tracking, detection of the use of deleted C++ objects, memory corruption detection, and broken message map usage.
API
Memory Validator provides two APIs for controlling Memory Validator from your application:
- One API is for direct control of Memory Validator.
- The service API is for using Memory Validator with services for the case when Memory Validator cannot inject into an application/service/IIS because Windows security privileges prevent that.
These APIs are designed so that you can leave them in your software if you want to – they will do nothing if Memory Validator is not present, allowing you to ship your software with the APIs intact. This means you don’t need to have additional build configurations for with API and without API.
HTML and XML export
Memory Validator provides powerful HTML and XML reporting capabilities, allowing you to produce overnight leak reports if you use Memory Validator as part of a testing strategy. In addition, because you can compare two sessions to discover regressions, you can also export the leak report from any regressed comparison to identify where regressions are happening in your tests.
Built to handle large data volumes
Unlike some of our competitors that struggle to handle even one million allocations, some of our customers are processing billions of allocations with Memory Validator.
Compatible
Memory Validator works with compilers from:
| Vendor | Language | Compiler / IDE |
|---|---|---|
| Microsoft | C++, C, Visual Basic 6, C#, VB.Net, J#, F#, .Net, .Net Core | Visual Studio |
| Intel | C++, C, Fortran | Intel Performance Compiler, Intel Fortran |
| Embarcadero | C++, C, Delphi | C++ Builder, Delphi, Rad Studio |
| MinGW | C++, C | g++ / gcc |
| Cygwin | C++, C | g++ / gcc |
| MSYS2 | C++, C | g++ / gcc |
| LLVM | C++, C | Clang |
| Qt | C++, C | QtCreator |
| Metrowerks | C++, C | Code Warrior |
| Salford Software | Fortran 95 | Fortran 95 |
We support many versions of Visual Studio: Visual Studio 2022, 2019, 2017, 2015, 2013, 2012, 2010, 2008, 2005, 2003, 2002 and Visual Studio 6 are supported.
All 32 bit and 64 bit (x64) Windows operating systems are supported, from Windows 11 to Windows XP.
.Net and .Net Core
If you’re using .Net and/or .Net Core, Memory Validator supports these technologies. All .Net versions are supported. All .Net Core versions are supported.
If you’re also using native code with your .Net applications, we’ve also got that covered, mixed mode applications are supported.
Applications, services, web servers
Memory Validator works with applications, services and IIS/Web Development Server, both native and mixed-mode .Net.
Regression test support
As well as the traditional interactive memory leak debugging role that Memory Validator performs, Memory Validator can be used to compare two recorded sessions to show the difference between the sessions. This allows you to determine if changes to your code have resulted in improvements (fewer memory leaks, fewer errors) or regressions (more memory leaks, more errors).
Command Line
Memory Validator also allows you to automate memory leak testing by launching Memory Validator from the command line.
A full range of command line options allows you to perform unattended runs of Memory Validator, complete with HTML export and XML export, to facilitate regression testing as part of your overnight builds.
Example 1 Launch a program with a specific startup directory, using two arguments, and save the session without showing the Memory Validator interface.
memoryValidator.exe -hideUI
                    -program c:\myProgram.exe
                    -directory c:\testbed
                    -arg " -macro c:\macros\testMacro1.vba"
                    -arg "secondArg"
                    -saveSession c:\results\testMacro1.mvm
Example 2 Launch a program with a specific startup directory, using two arguments, save the session, compare the recorded session with a known baseline and export the comparison results to HTML and XML. The Memory Validator interface is not shown.
memoryValidator.exe -hideUI
                    -program c:\myProgram.exe
                    -directory c:\testbed
                    -arg " -macro c:\macros\testMacro1.vba"
                    -arg "secondArg"
                    -saveSession c:\results\testMacro1.mvm
                    -baseline c:\baselines\testMacroBaseline.mvm
                    -sessionCompareHTML c:\regression\testMacro1.html
                    -sessionCompareXML c:\regression\testMacro1.xml
Memory Validator Feature List
- Detect memory leaks
- Detect handle leaks (including GDI and User32 leaks)
- Detect incorrect memory deallocation
- Detect multiple memory deallocation
- Detect heap overruns
- Detect heap underruns
- Detect heap corruption
- Detect stack overruns
- Detect stack underruns
- Detect memory re-use (the re-use of deleted objects)
- Detect uninitialised data in C++ objects
- Detect COM leaks
- Detect BSTR leaks
- Support reference counting for user-managed heaps
- Detect memory leaks from user-managed heaps
- Detect potentially unused memory
- Detect potentially leaked memory
- Detect handle leaks
- Show memory and handles on a per-thread basis, or for any and all threads
- Detect “Release only” crashes caused by using the wrong function signature in MFC message maps
- Detect memory leaks from custom memory allocators in 3rd party DLLs
- Allocation/object query by address, size, type.
- Allocation/object search.
- Object query.
- Address query.
- Function query.
- Related memory / handles query.
- Cross-thread allocation detector.
- Filtering. Comprehensive filtering to allow you to display just the data you want to display.
- Filter memory and handles by thread id.
- Watermarks. Used for isolating sections of the data.
- Bookmarks. Never forget all those places of interest in the current session.
- Tag trackers. View data according to your classifications.
- Session to session comparison.
- Command line execution.
- Support for regression testing.
- Data export (HTML, XML).
- Start by launching an application and monitoring that application (or a child process).
- Start by injecting into a running process.
- Start by waiting for a process to start and injecting into that process at startup.
- Link to API binary to gain access to the instrumentation API.
- Link to service API binary to use Memory Validator with your service/IIS.
- Instrumentation API to allow customised data collection for advanced users.
- Instrumentation is fast, a few seconds, not tens of minutes.
- Runs at nearly full speed of non-instrumented application, not 2 or 10 times slower.
- Instrumentation can be customized at the DLL level or down to the function level, as you require. Completely flexible as to which functions you choose to instrument.
- Instrumentation DLL can be extended by writing your own Dlls which the instrumentation DLL can load (configurable) to call functions written by you. Such functions could perform statistical analysis of object allocation etc.
- No need to rebuild or relink your application.
- Minimal compile and link to allow the use of instrumentation API.
- Minimal compile and link to use Memory Validator with NT services if you want to track the whole service.
Software Updates
We update our software tools on a regular basis – on average, about 26 updates per year. Updates are optional, and you only need to download the most recent update to be up-to-date.
You can set up automatic software updates using the credentials we supply to you when you purchase. Automatic software updates can be set up to check daily, weekly, monthly or never.
