Python Performance Validator
Python Performance Validator is a performance profiler for use by software developers and software quality assurance testers using Python 2.2.
Use Python Performance Validator to:
- Identify slow (time consuming) functions in your application.
- Identify busy (called very often, not necessarily slow) functions in your application.
- View application behaviour in real time.
- Improve your software quality testing with interactive, profiling displays.
- Create profiling reports with collapsible call tree and call graphs to share with your team on your intranet.
- Command line API to support automated use (Jenkins, etc).
4 Minute Video
Performance profiling with Python Performance Validator.
4 step python performance profiling
To use Python Performance Validator all you need is your python program. You do not need to modify your software to use Python Performance Validator.
- Launch your application with Python Performance Validator.
- Run your application as normal.
- Close your application.
- Examine the profiling statistics that are generated as your application runs.
Easy-to-read data displays show you the performance statistics as your application executes. You do not need to wait until your application has finished to view statistics for any class, function or file. The displays can be filtered to show you only the information that you want to work with.
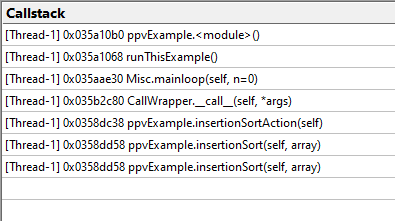
Real-time callstack

Profiling call tree
Detailed, colour coded source code shows at-a-glance which functions and lines have executed and how long each took.

Configurable
Python Performance Validator can be configured to collect all data or just the data you need. Powerful filters for collecting data and for displaying collected data give you maximum flexibility and control over how much CPU time is spent and how much memory is used collecting data allowing you to choose how much effort is put into a given task.
Filtering
The default options of Python Performance Validator provide profiling data for all files in your application. If you wish only to create profiling reports for selected files, or exclude certain file types or even specific classes and methods, Python Performance Validator has filtering capabilities to allow such customisation.
Exporting profiling data
Python Performance Validator provides powerful HTML and XML reporting capabilities, allowing you to produce overnight leak reports as part of your regression testing strategy.
You can share the HTML and XML with your colleagues or post them on your company intranet. The HTML reports can include animated collapsible call trees and call graphs.
Compatible
Python Coverage Validator works with 32-bit Python versions from 2.2 to 2.7.
Regression test support
As well as the traditional performance profiling role that Python Performance Validator performs, Python Performance Validator can be used for interactive profiling and for creating profiling reports automatically as part of a regression test suite and/or overnight build.
Command Line
Automate your python profiling by launching Python Performance Validator from the command line.
A full range of command line options allows you to perform unattended profiling with Python Performance Validator, complete with HTML export and XML export, to facilitate regression testing as part of your overnight builds.
Example 1 Launch a program, record profiling data and save the session.
pPerformanceValidator.exe -program "c:\myProgram.py"
                          -saveSession "c:\myResults\session1.ppvm"
                          -displayUI -refreshStatistics -refreshAnalysis -refreshCallTree
Example 2 Launch a program with a specific startup directory, record profiling data and save the session. A previous session is loaded and compared to the recorded session, the results are exported to HTML.
pPerformanceValidator.exe -program "c:\myProgram.py"
                          -saveSession "c:\myResults\session1.ppvm"
                          -displayUI -refreshStatistics -refreshAnalysis -refreshCallTree
                          -directory "c:\testarea"
                          -sessionLoad "c:\myResults\session1.ppvm"
                          -compareByParentTime
                          -exportAsHTML "c:\myResults\session2.html"
                          -sessionCompareHTML "c:\myResults\comparison_1_2.html"
Software Updates
Sorry, there are no software updates for Python Performance Validator.
Legacy Software
This is the last version of Python Performance Validator we released in 2014.
- The automatic configuration of Python Performance Validator does not work because of changes to Windows since 2014. You will need to configure the Python runtime manually. Do this by following the instructions in the video at the top of this page.
- Our software codebase has changed quite a bit since 2014. Reaching the point where we can build a modern version of Python Performance Validator will take some work. At that point we can consider software updates.
- There is no online documentation. Documentation is in Windows Help format (.chm) and is downloaded with the software.