Performance Validator Tutorials

The Tutorials

Getting Started

Why is Profiling Important?

Types of profiling: Sampling and instrumentation.

Callstack

Statistics and Relations.

Call Tree

Call Graph

Analysis

Line Timing

How to profile only selected parts of your application.

How to exclude profiling MFC for statically linked and dynamically linked applications.

How to restrict instrumentation to specific parts of your application.

How to improve instrumentation speed.

Customizing embedded statistics.

Identifying slow code.

Reseting statistics.

Using Stop and Start.

Performance profiling a child process

Performance profiling a .Net Core application

Performance profiling a .Net Core application child process

Performance profiling a service

Performance profiling for a service child process

Performance profiling an IIS ISAPI DLL

Performance Profiling ASP.Net with IIS

Performance profiling ASP.Net with Web Development Server

Command Line Performance Profiling a Child Process
Performance profiling a service
This tutorial describes how to performance profile a service.
This tutorial covers the following:
-
- Modifying a service to use the NT Service API.
- How to use the Performance Validator user interface to performance profile the service.
Related tutorials:
Performance profiling a child process.
Performance profiling a service.
Performance profiling a child process of a service.
Performance profiling an IIS ISAPI DLL.
Performance profiling ASP.Net with IIS.
Performance profiling ASP.Net with Web Development Server.
Native services and mixed-mode services
This tutorial applies to all native services and to mixed-mode services that start the service that uses the native Win32 services API.
.Net services
If your service is written entirely in .Net or .Net Core, or your service is mixed-mode with the startup code written in .Net or .Net core you can skip the part of this tutorial relating to the NT Service API and go straight to the performance profiling a service section.
Example Service
Performance Validator ships with an example service in the examples\service folder in the Performance Validator installation directory.
Installing the example service
- Open an administrator mode cmd prompt
- Type servicePV_x64.exe -install
Starting the example service
- Open an administrator mode cmd prompt
- Type servicePV_x64.exe -start
or
- Start the services control panel (type services in the Windows 10 search bar, then choose the Services app).
- Find the service in the list of services, right-click to display the context menu, then choose Start.
Stopping the example service
- Open an administrator mode cmd prompt
- Type servicePV_x64.exe -stop
or
- Start the services control panel (type services in the Windows 10 search bar, then choose the Services app).
- Find the service in the list of services, right-click to display the context menu, then choose Stop.
Uninstalling the example service
- Open an administrator mode cmd prompt
- Type servicePV_x64.exe -remove
The service has already been modified to use the NT Service API. In this tutorial, we’ll describe the modifications you would make to the service to make it work correctly with Performance Validator.
What is the NT Service API?
The NT Service API is a simple API that allows you to load the Performance Validator profiling DLL and start the process of performance profiling.
The API also includes some debugging functions to help provide debugging information via log files (the only way to get data out of a service without a connection to the Performance Validator user interface).
Modifying your service to use the NT Service API
- Identify your service’s ServiceMain function, and just before that function, add a new function definition called serviceCallback(). In the example service, the ServiceMain is called service_main().
The purpose of serviceCallback() is to regularly tell the service control manager that the service is alive. This prevents the service from being killed for being unresponsive if the instrumentation of your service takes too long (where too long is defined by the service control manager).
void serviceCallback(void *userParam) { // just tell the Service Control Manager that we are still busy // in this example userParam is not used static DWORD dwCheckPoint = 1; ssStatus.dwServiceType = SERVICE_WIN32_OWN_PROCESS; ssStatus.dwServiceSpecificExitCode = 0; ssStatus.dwControlsAccepted = 0; ssStatus.dwCurrentState = dwCurrentState; ssStatus.dwWin32ExitCode = dwWin32ExitCode; ssStatus.dwWaitHint = dwWaitHint; ssStatus.dwCheckPoint = dwCheckPoint++; // Report the status of the service to the service control manager. return SetServiceStatus(sshStatusHandle, &ssStatus); } - At the start of service_main() set the log file name and delete the log file, erasing any logging from a previous run of the service. This is to prevent debugging information from one session from interfering with another.
svlPVStub_setLogFileName(SZLOGFILENAME);
svlPVStub_deleteLogFile();
- After the call to RegisterServiceCtrlHandler(), load the Performance Validator profiling DLLs with a call to svlPVStub_LoadPerformanceValidator(), or if you’re profiling x86 service from the x64 GUI call svlPVStub_LoadPerformanceValidator6432(). The return code should be checked to identify success or to be converted into a human-readable string to be written to the log file.
#ifdef IS6432
// x86 with x64 GUI
errCode = svlPVStub_LoadPerformanceValidator6432();
#else    //#ifdef IS6432
// x86 with x86 GUI
// x64 with x64 GUI
errCode = svlPVStub_LoadPerformanceValidator();
#endif   //#ifdef IS6432
if (errCode != SVL_OK)
{
   DWORD   lastError;

   lastError = GetLastError();
   svlPVStub_writeToLogFileW(_T("Performance Validator load failed. \r\n"));
   svlPVStub_writeToLogFileLastError(lastError);
   svlPVStub_writeToLogFile(errCode);

   svlPVStub_dumpPathToLogFile();
}
else
{
   svlPVStub_writeToLogFileW(_T("Performance Validator load success. \r\n"));
}
- Next, we inform Performance Validator about the service callback. This must be done after the Performance Validator DLLs are loaded, not before.
errCode = svlPVStub_SetServiceCallback(serviceCallback, // the callback NULL); // some user data if (errCode != SVL_OK) { svlPVStub_writeToLogFileW(_T("Setting service callback failed. \r\n")); svlPVStub_writeToLogFile(errCode); } - Finally, we start Performance Validator instrumenting your service to collect performance profiling data.
errCode = svlPVStub_StartPerformanceValidator();
if (errCode != SVL_OK)
{
   DWORD   lastError;

   lastError = GetLastError();
   svlPVStub_writeToLogFileW(_T("Starting Performance Validator failed. \r\n"));
   svlPVStub_writeToLogFileLastError(lastError);
   svlPVStub_writeToLogFile(errCode);
}
else
{
   svlPVStub_writeToLogFileW(_T("Finished loading Performance Validator\r\n"));
}
Performance profiling the service
Now that the NT Service API has been implemented in your service, we can start performance profiling the service.
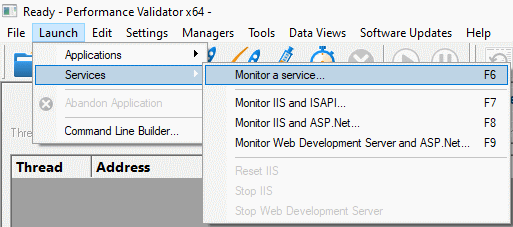
- Choose the Launch > Services > Monitor a service… option.

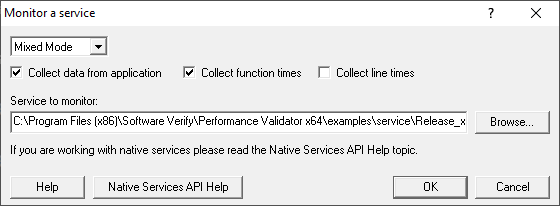
- The Monitor a service dialog is displayed.

Select the service executable you are going to monitor. For this example the application is examples\service\Release_x64\servicePV_x64.exe.
Choose the appropriate native/mixed-mode/.Net option to specify which types of code you want to performance profile. Mixed-mode is the default, as this performance profiles all types of code.
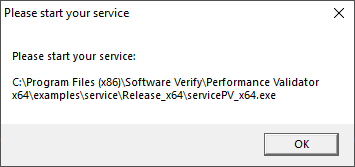
- When you click OK, Performance Validator will set up everything needed to interact with the NT Service API and then present you with a dialog box.

- Start your service.
- Close the dialog box.
- Performance Validator will instrument your service and start performance profiling.
Finishing profiling the service
To finish profiling the service, you need to stop your service.
Performance Validator will profile the service shutdown procedure and then present you with the profiling results.
I’m not getting any profiling timing data. What can I do?
There are a few things to check.
- Have you correctly added the NT Service API to the service?
- Check the log file for any errors. You specified the log file in step 2 with the call
svlPVStub_setLogFileName(SZLOGFILENAME);
- Check the diagnostics tab. If the NT Service API is working correctly Performance Validator will have some data. Information on instrumentation failures will be on the diagnostic tab.
- Check the debug information dialog. You can access this from the Tools > DLL Debug Information… menu. This dialog will tell you which DLLs have debug information and which do not. Any DLLs that don’t have debug information you’ll need to ensure that debug information is built for these DLLs and is findable.
Conclusion
You have learned how to add the NT Service API to a native service, how to use Performance Validator to monitor a service, and what to look at to diagnose errors if things don’t work first time.