Debugging a crash with single stepping
If you’ve ever used a debugger you’re probably familiar with the concept of single stepping through code – executing one instruction at a time until you find the particular instruction that causes the crash.
The Problem – Inaccessible Locations
But what if the crash happens in somewhere that’s hard for you to debug, for example deep inside ExitProcess() or millions of instructions after the last location that you know about that is in your code?
The Solution – Automation
The solution to this problem is a dedicated tool that will single step through your code automatically without requiring you to tell the debugger to single step the next instruction.
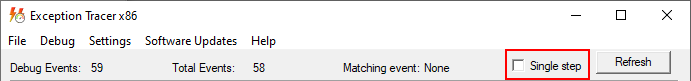
Exception Tracer has a dedicated single-step mode that you can use for this.
However, using Exception Tracer from it’s user interface you can attach to your program, but that doesn’t guarantee single stepping will happen in the right place for you. You could end up single stepping through tens of thousands of lines of code (millions of instructions) that you don’t need to before you get to the part of the program that you know is interesting. You could spend hours waiting for the trace to get to the part of the code that you think is going to be interesting for the purposes of understanding the bug. I know, I’ve waited overnight for single stepping results.
What if you could be more specific about when you choose to attach Exception Tracer you could save hours of time, increasing your productivity?
The solution is to add a single call to your application to launch exception tracer from within your program so that Exception Tracer starts single stepping your application from that exact location.
attachExceptionTracerX64(GetCurrentProcessId());
The function looks like this:
static const TCHAR *ET_X86_PATH = _T("C:\\Program Files (x86)\\Software Verify\\ExceptionTracer\\exceptionTracer.exe");
static const TCHAR *ET_X64_PATH = _T("C:\\Program Files (x86)\\Software Verify\\ExceptionTracer\\exceptionTracer_x64.exe");

void attachExceptionTracer_internal(const TCHAR*    pathToExceptionTracer,
                                    DWORD           processId)
{
    int                    b;
    DWORD                  dwCreateFlags;
    STARTUPINFO            startupInfo;    // put info about startup here for CreateProcess()
    PROCESS_INFORMATION    procInfo;        // info about the process is placed here
    CString                theCmdLine;

    theCmdLine.Format(_T("%s /process %d /singleStepRequired:On"), pathToExceptionTracer, processId);

    startupInfo.cb = sizeof(STARTUPINFO);
    startupInfo.lpReserved = NULL;
    startupInfo.lpDesktop = NULL;
    startupInfo.lpTitle = NULL;
    startupInfo.dwX = 0;
    startupInfo.dwY = 0;
    startupInfo.dwXSize = 400;
    startupInfo.dwYSize = 400;
    startupInfo.dwXCountChars = 40;
    startupInfo.dwYCountChars = 25;
    startupInfo.dwFillAttribute = 0;
    startupInfo.dwFlags = STARTF_USESHOWWINDOW;
    startupInfo.wShowWindow = SW_SHOW;
    startupInfo.cbReserved2 = 0;
    startupInfo.lpReserved2 = NULL;
    startupInfo.hStdInput = NULL;
    startupInfo.hStdOutput = NULL;
    startupInfo.hStdError = NULL;

    procInfo.hProcess = NULL;
    procInfo.hThread = NULL;
    procInfo.dwProcessId = NULL;
    procInfo.dwThreadId = NULL;

    dwCreateFlags = NORMAL_PRIORITY_CLASS;

    b = CreateProcess(NULL,                                  // program
                      (TCHAR *)(const TCHAR *)theCmdLine,    // command line
                      NULL,                                  // process attributes (use default)
                      NULL,                                  // thread attributes (use default)
                      FALSE,                                 // inheritance (don't)
                      dwCreateFlags,                         // how to create the process
                      NULL,                                  // environment (use parent's, ie this)
                      NULL,                                  // current directory (same as this process if NULL)
                      &startupInfo,                          // startup info
                      &procInfo);                            // process info (return value)
    if (b)
    {
        WaitForInputIdle(procInfo.hProcess, INFINITE);

        CloseHandle(procInfo.hProcess);
        CloseHandle(procInfo.hThread);
    }
}

void attachExceptionTracerX86(DWORD	processId)
{
    attachExceptionTracer_internal(ET_X86_PATH, processId);
}

void attachExceptionTracerX64(DWORD	processId)
{
    attachExceptionTracer_internal(ET_X64_PATH, processId);
}
There’s also some helper functions to calculate the path to Exception Tracer based on values stored in the registry. All you need to do is:
- #include attachExceptionTracer.inl into the source file where you want to start Exception Tracer
- call attachExceptionTracerX86 or attachExceptionTracerX64 as appropriate to start Exception Tracer
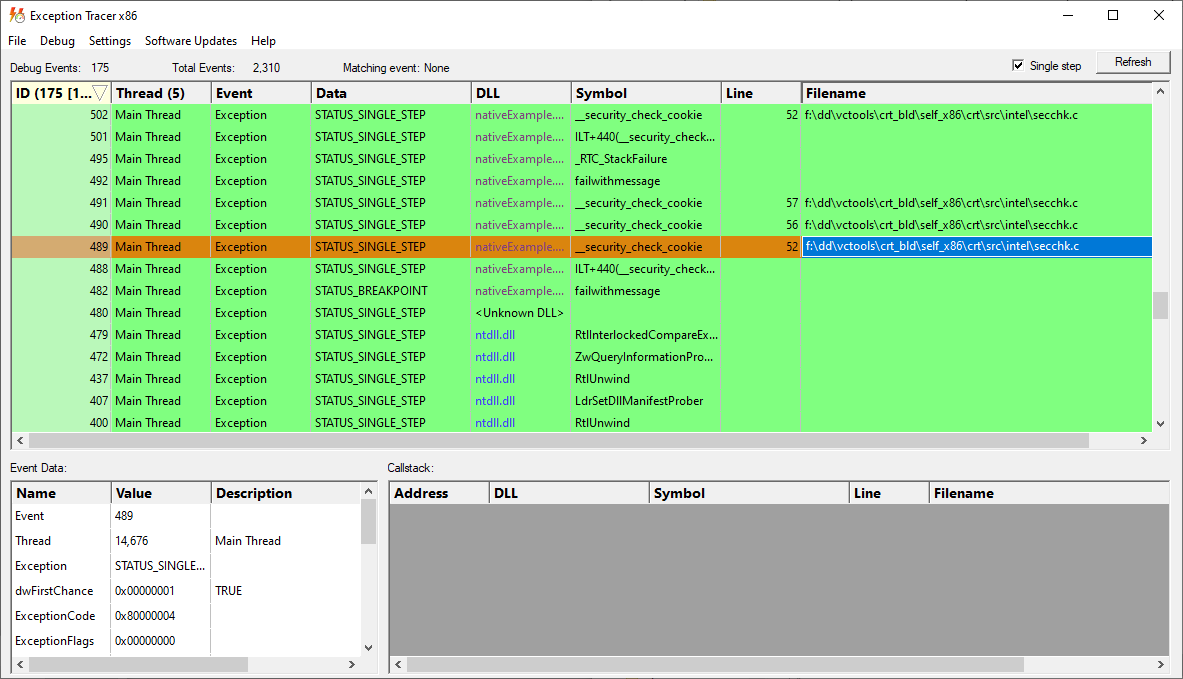
Exception Tracer will attach to the application with single stepping enabled and run until the program exits. After the program exits the trace will be processed and then displayed for you to analyse.
The trace shown below shows single stepping into a buffer overrun crash being detected.