Thread monitoring made easy
Tools like Thread Validator are great for delving into the details of why a thread deadlock has occurred. You get all the gory details, DLL, filename, line number, lock, mutex, wait, and sequence of lock acquisition on each thread. You can work out why the failure occurred.
But sometimes this is overkill, more than you need, for this particular bug. Perhaps you don’t think the bug is real, but just an artefact of how things are working. You don’t want to spend time in the heavyweight tool, not today, but perhaps next week.
What you want is a tool with a lighter impact on the system. A tool that will just tell you that what you think is a problem, really is a problem, or actually is not a problem. If it’s not a problem you can just move on to the next topic, if it is a problem, time to get the serious tools out and investigate the problem.
That is where Thread Status Monitor is very useful. We wrote an early version of this tool some time ago. It was hosted on Object Media where we publish source code for some of our tools. We have improved the tool a bit and decided that it is a better fit for the Software Verification website.

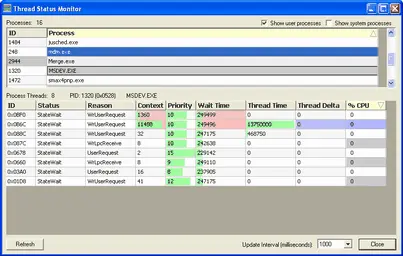
Thread Status monitor tells you everything you need to know about each thread in a process. The thread id, its wait status, the wait reason, the number of context switches, thread priority, how long the thread has spent waiting, how long the thread has been executing, and how much CPU the thread is currently consuming.
Where appropriate bar graphs are used to provide visual indicators as to which items are the largest. Colour coding (pink/blue) is also used to indicate values increasing and decreasing, drawing your attention to the latest changes.

Simply select the process you wish to monitor in the list at the top of the user interface and view the threads in the lower pane. You can change the refresh rate using the combo box and sort by clicking on the column header you want to sort.
Thread Status Monitor will be available in the next few days.