Identifying crashes with the Windows Event Log
It’s an unfortunate and inevitable fact that while developing software, sometimes your software will crash. This also happens, sometimes, hopefully very infrequently, in production code. Each time this happens, Windows stores information about each crash in the Windows Event Log, along with many other events in the Windows crash log.
You can inspect these using the Windows Event Viewer, but to find them you’ll be wading through lots of other data about the behaviour of the operating system. It’s needle in a haystack time.
There is a better way.
In this article, I will explain two event log entry types which encode crashes and how to read them. Then, I’ll also introduce some tools that take the drudgery out of converting this information into a symbol, filename and line number to enable you to identify the location of the crash and possibly its root cause.
The Event Log Services
The Windows error reporting service and Windows event collector work together to collect and store detailed information about successful events, operation failures, critical errors, faulty drivers and application crashes in the Windows event log.
Three services work together to provide the Windows Event Log. These are the event log service names:
- Windows Error Reporting Service
- Windows Event Collector
- Windows Event Log
The Windows Event Log
The Windows event log can be viewed using Microsoft’s Event Viewer. Just type “Event Viewer” in the start menu search box and press return. That should start it.
Crash information is stored in the sub category “Application” under “Windows Logs”. The two event sources that describe crashes are Windows Error Reporting and Application Error. These are event id 1000 and 1001.
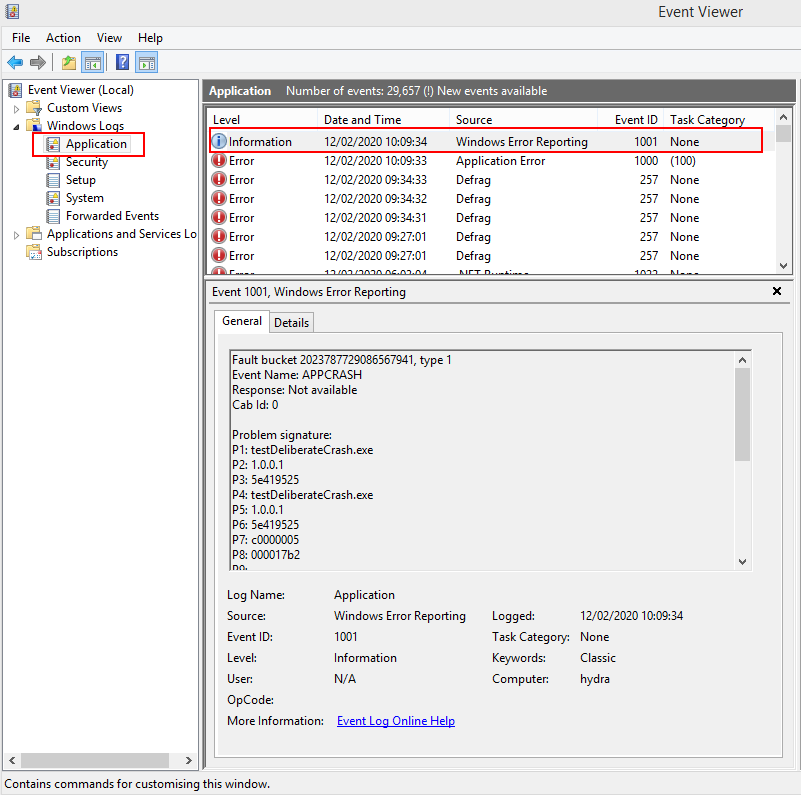
The image above shows a Windows Error Reporting event has been selected. The human readable form is shown below in the General tab. Although I say human readable, it really is unintelligible gibberish. None of the fields are identified and you have nothing to work with. The details tab isn’t any better – the raw data is present in text or XML form. Here’s the XML for the crash shown above.
<Event xmlns="http://schemas.microsoft.com/win/2004/08/events/event">
  <System>
    <Provider Name="Windows Error Reporting" />
    <EventID Qualifiers="0">1001</EventID>
    <Level>4</Level>
    <Task>0</Task>
    <Keywords>0x80000000000000</Keywords>
    <TimeCreated SystemTime="2020-02-12T10:09:34.000000000Z" />
    <EventRecordID>260507</EventRecordID>
    <Channel>Application</Channel>
    <Computer>hydra</Computer>
    <Security />
  </System>
  <EventData>
    <Data>2023787729086567941</Data>
    <Data>1</Data>
    <Data>APPCRASH</Data>
    <Data>Not available</Data>
    <Data>0</Data>
    <Data>testDeliberateCrash.exe</Data>
    <Data>1.0.0.1</Data>
    <Data>5e419525</Data>
    <Data>testDeliberateCrash.exe</Data>
    <Data>1.0.0.1</Data>
    <Data>5e419525</Data>
    <Data>c0000005</Data>
    <Data>000017b2</Data>
    <Data />
    <Data />
    <Data>C:\Users\stephen\AppData\Local\Temp\WERC24C.tmp.WERInternalMetadata.xml</Data>
  <Data>C:\Users\stephen\AppData\Local\Microsoft\Windows\WER\ReportArchive\AppCrash_testDeliberateCr_c31b903842d94a84d4621dceaac377462674f7a_eb589596_139ec4bd</Data>
    <Data />
    <Data>0</Data>
    <Data>c3d360b2-4d7f-11ea-83d3-001e4fdb3956</Data>
    <Data>0</Data>
    <Data>54756af49aec84f97c15f03794ffd605</Data>
  </EventData>
</Event>
There’s quite a bit of data in here, the purpose of each field implied, not stated. Towards the end is some information related to a crash dump, but if you go searching for it, the minidump will no longer be present.
The format for Application Error crashes is different.
Windows Error Reporting
The event log data for a Windows Error Reporting event contains many fields that we don’t need if we’re just investigating a crash address. Each event starts with an <Event> tag and ends with an </Event> tag.
We need to correctly identify the event. Inside the event is a <System> tag which contains a tag with an attribute “Provider Name” set to “Windows Error Reporting” and “Event ID” set to 1001.
Once the event is identified we need to find the <EventData> tag inside the event. The <EventData> contains 14 <Data> tags.
The first four tags are always the same:
- 1. Timestamp.
- 2. Number of data items.
- 3. Information Type.
- 4. Information Status.
We can use the Information Type to determine how to process all the data. There are two Information Types that interest us.
APPCRASH
APPCRASH data is for a most application crashes.
If Information Type is “APPCRASH”, the data is:
- 1. Timestamp.
- 2. Number of data items.
- 3. Information Type.
- 4. Information Status.
- 5. Unknown.
- 6. Crashing executable.
- 7. Executable version.
- 8. Executable timestamp.
- 9. Crashing DLL. This will be the same as 6 if the crash is in the .exe.
- 10. DLL version. This will be the same as 7 if the crash is in the .exe.
- 11. DLL timestamp. This will be the same as 8 if the crash is in the .exe.
- 12. Exception code.
- 13. Fault offset.
- 14. Class. This may or may not be present
We’re interested in tags 9, 12 and 13.
If we want to version the crashing DLL we also need tags 10 and 11.
BEX
BEX data is for a buffer overflow exception or Data Execution Prevention exception.
If Information Type is “BEX” or “BEX64”, the data is different:
- 1. Timestamp.
- 2. Number of data items.
- 3. Information Type.
- 4. Information Status.
- 5. Unknown.
- 6. Crashing executable.
- 7. Executable version.
- 8. Executable timestamp.
- 9. Crashing DLL. This will be the same as 6 if the crash is in the .exe.
- 10. DLL version. This will be the same as 7 if the crash is in the .exe.
- 11. DLL timestamp. This will be the same as 8 if the crash is in the .exe.
- 12. Fault offset.
- 13. Exception code.
- 14. Class. This may or may not be present
Note that the order of the fault offset and exception code has been reversed compared to APPCRASH.
We’re interested in tags 9, 12 and 13.
If we want to version the crashing DLL we also need tags 10 and 11.
Application Error
The event log data for an Application Error event contains many fields that we don’t need if we’re just investigating a crash address. Each event starts with an <Event> tag and ends with an </Event> tag.
We need to correctly identify the event. Inside the event is a <System> tag which contains a tag with an attribute “Provider Name” set to “Application Error” and and “Event ID” set to 1000.
Once the event is identified we need to find the <EventData> tag inside the event. The <EventData> contains at least 12 <Data> tags, some of which may not be present, or which may be empty. These tags are present:
- 1. Crashing executable.
- 2. Executable version.
- 3. Executable timestamp.
- 4. Crashing DLL. This will be the same as 1 if the crash is in the .exe.
- 5. DLL version. This will be the same as 2 if the crash is in the .exe.
- 6. DLL timestamp. This will be the same as 3 if the crash is in the .exe.
- 7. Exception code.
- 8. Fault offset.
- 9. Process id.
- 10. Application start timestamp.
- 11. Application path.
- 12. Module path.
Of these tags we’re interested in tags 7, 8 and 12.
If we want to version the crashing DLL we also need tags 5 and 6. If 12 isn’t available, use 4.
Removing the drudgery
The previous two sections have described which fields to extract data from. If you’re doing this manually this is tedious and error prone:
- You have to search for the event id or event name. In most Windows event logs there will be multiple items to examine.
- For each item that matches your event id search you need to select the correct values from the correct fields and then use another application to turn them into a symbol, filename and line number.
- Our tools DbgHelpBrowser, DWARF Browser, TDS Browser and MapFileBrowser are designed to take a crash offset inside a DLL and turn it into a human readable symbol, filename and line number. But that still requires you to do the hard work of fishing the correct data out of the XML dump.
Now there is a better way, we’ve added an extra option to these tools that allows you to paste the entire XML data from a crash event and the tool then extracts the data it needs to show you the symbol, filename and line number.
DbgHelpBrowser
Load the crashing exe (or DLL) into DbgHelpBrowser. This will cause the symbols to be loaded for the DLL (assuming symbols have been created and can be found). We’re not covering versioning the DLL as most likely you will have your own methods for this.
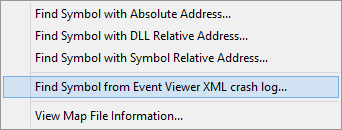
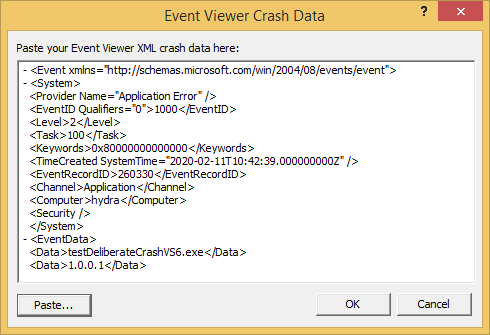
Choose the option Find Symbol from Event Viewer XML crash log… on the Query menu. The Event Viewer Crash Data dialog is displayed.

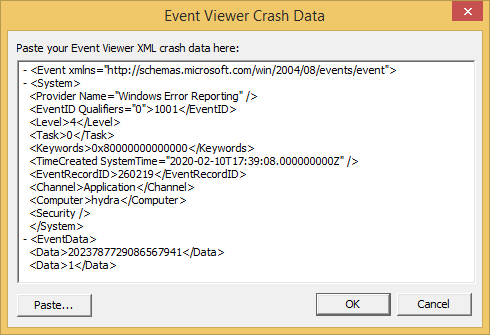
Paste the XML data into the dialog and click OK.
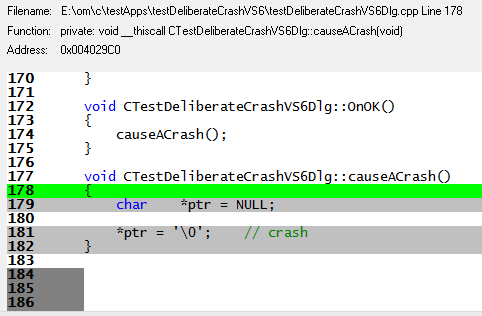
The main display will select the appropriate symbol in the main grid and display the relevant symbol, filename, line number and source code in the source code viewer below.
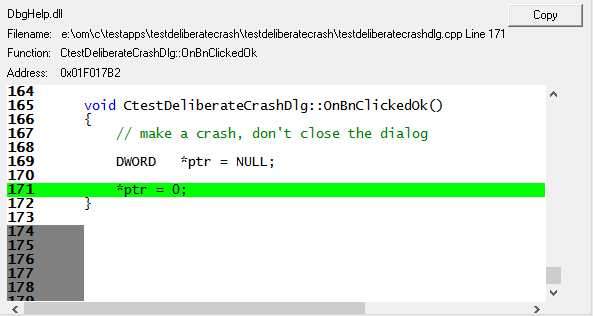
The process for DWARF Browser and TDS Browser is the same as for DbgHelp Browser, but these tools operate on different types of debug information.
MapFileBrowser
Load the MAP file for the crashing exe (or DLL) into MapFileBrowser. We’re not covering versioning the DLL as most likely you will have your own methods for this.
Choose the option Find Symbol from Event Viewer XML crash log… on the Query menu. The Event Viewer Crash Data dialog is displayed.
Paste the XML data into the dialog and click OK.
The main display will select the appropriate symbol in the main grid and display the relevant symbol, filename, line number and source code in the source code viewer below.
Conclusion
Windows Event Logs can be hard to read and error prone to use.
However when paired with suitable tools you can quickly and easily turn event log crashes into useful symbol, filename and line number information to inform your debugging efforts.
Use Event Log Crash Browser to discover crash information in your event log today.