Virtual Memory Validator
VM Validator is a virtual memory viewer that allows you to monitor the committed virtual memory and physical memory of an application as it runs.
You can also view the virtual memory layout of the memory data stored in a minidump.
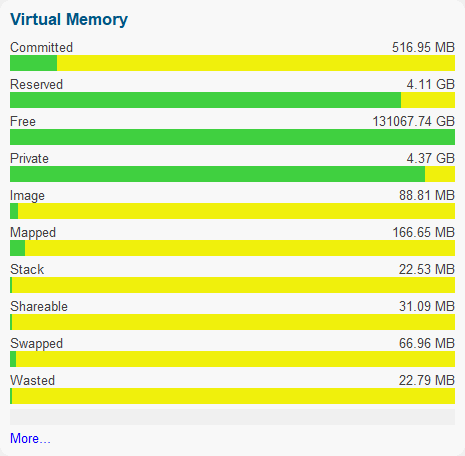
All committed memory types are displayed, with additional data indicating private, image (DLL, EXE), memory mapped, thread stacks, shared memory, memory that has been swapped in/out and wasted memory.
A summary view is provided, plus detailed information displays both at the operating system page size (4KB) and VirtualAlloc() size (64KB).
Filters are provided to allow you to concentrate on a particular type of memory and if part of the working set or not.
Virtual memory data can be saved for later inspection by Virtual Memory Validator.
Summary View
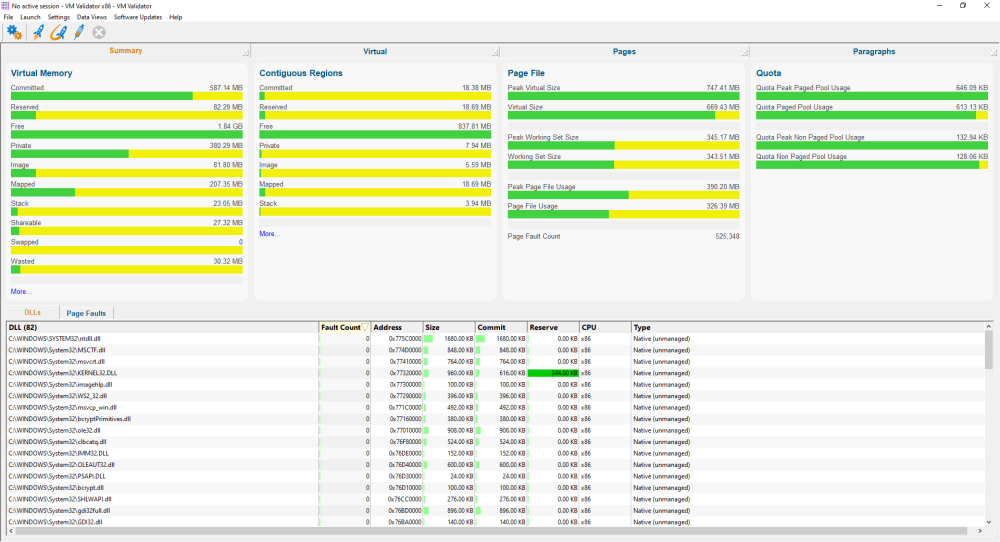
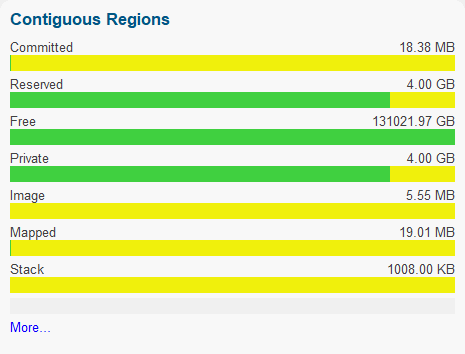
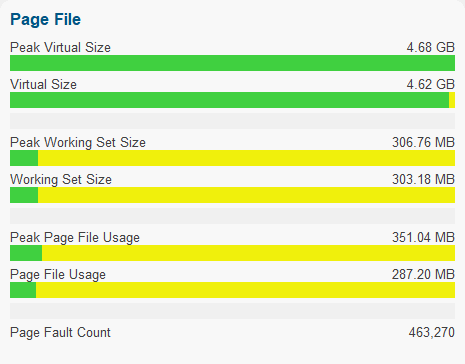
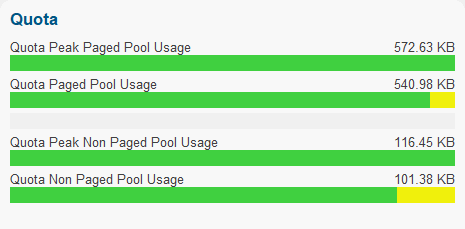
The summary view provides you with summary information about the memory usage of the application being monitored. There are four panels at the top that provide headline statistics for Virtual Memory, Contiguous Regions, Page File and Quota.
Below is data for each DLL that is loaded, and data for each page fault address.
Virtual Memory
Virtual Memory Contiguous Regions
Page File
Quota
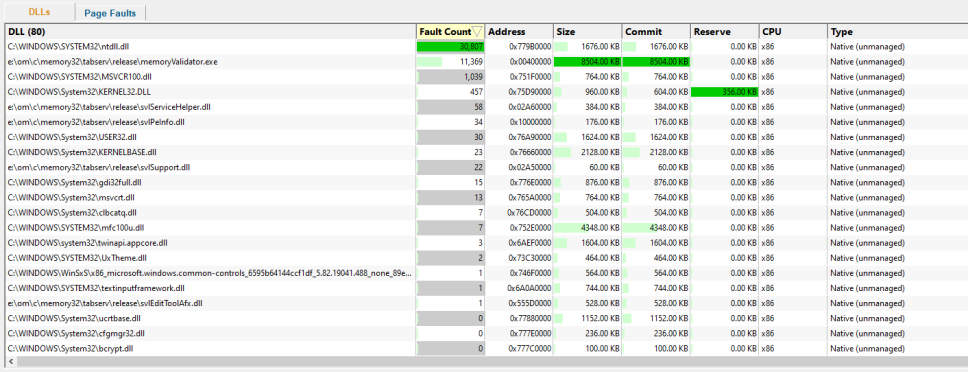
DLLs
The DLLs view shows each DLL in the application, how many page faults have occurred for that DLL, the DLL load address, DLL size, the amount of committed and reserved memory, the CPU type for the DLL and if the DLL is native, .Net or mixed mode. A context menu provides quick access to viewing any DLL in PE File Browser.
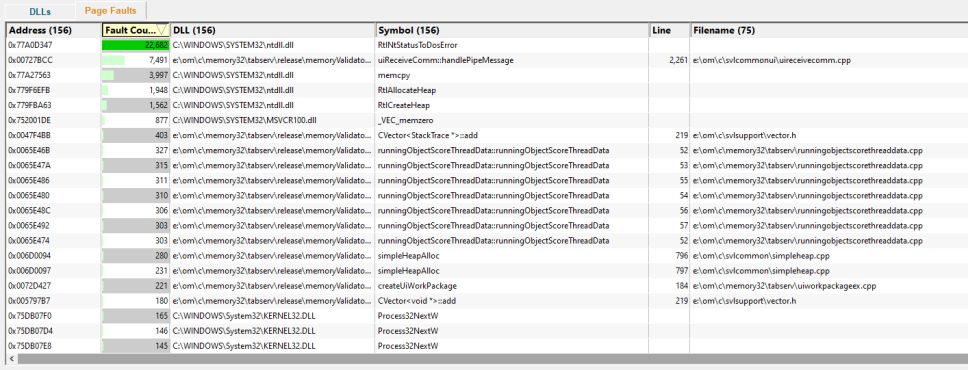
Page Faults
The Page Faults view shows each page fault address, how many times a fault has occurred at this address, and which DLL this address is part of. If the address is in a DLL, additional data is displayed: the symbol, filename and line number corresponding to that address. A context menu provides quick access to viewing any DLL in PE File Browser.
By analysing which parts of your application cause page faults, you can determine which parts can benefit from different memory layouts, memory allocation algorithms and memory access algorithms.
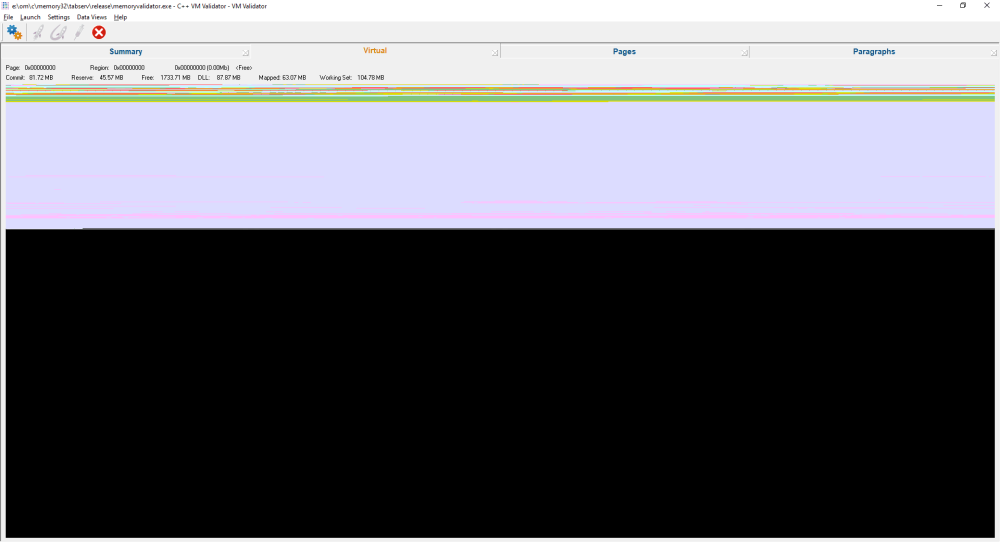
Virtual
The virtual view shows you the virtual address space as a colour-coded graphic image. As you move the cursor around, the description of the area under the cursor is updated to show the type of memory, if it is a DLL, thread stack space or other memory.
Pages
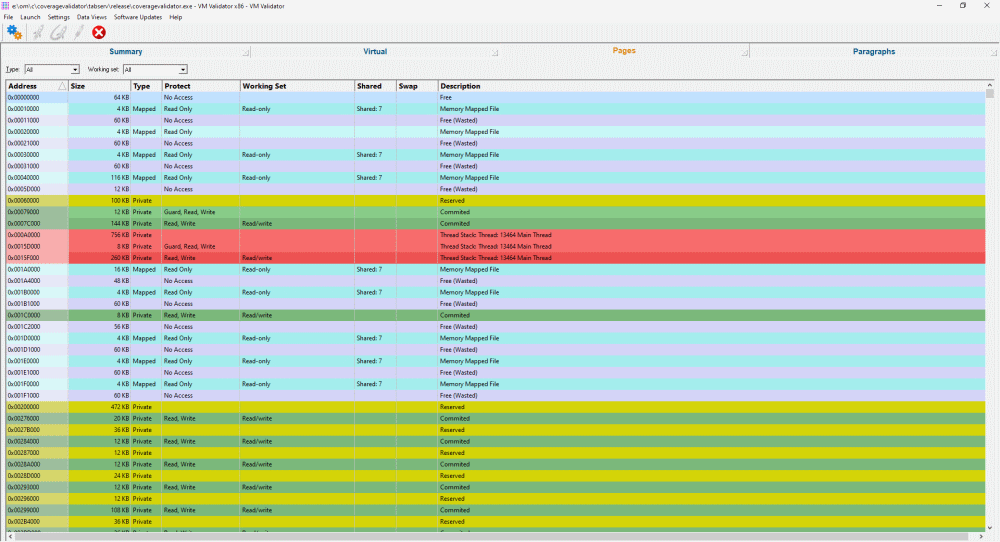
The pages view shows you the virtual memory usage and page protection status of virtual memory pages in the monitored application.
DLLs, threads, shared memory, swapped memory and wasted memory are identified.
Paragraphs
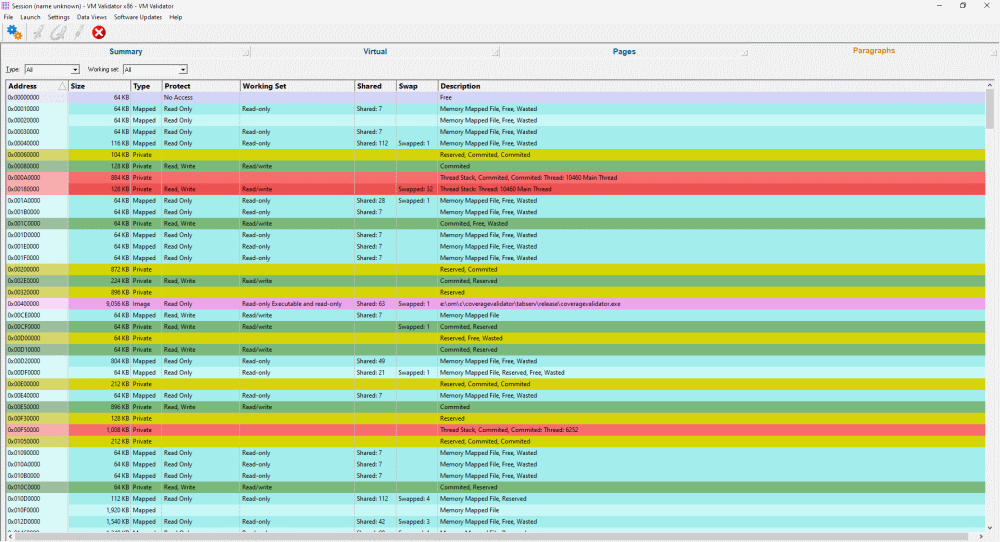
The paragraphs view shows you the virtual memory usage and page protection status of every virtual memory allocation paragraph (the smallest unit allocated by VirtualAlloc()) in the application being monitored.
DLLs, threads, shared memory, swapped memory and wasted memory are identified.
Filters
The pages view and the paragraphs view provide two filters. One filters by memory type, and the other filters by working set.
![]()
Memory Type Filter
The memory type filter chooses which type of memory is displayed.
- All. All types of memory.
- Committed. Committed memory.
- Reserved. Reserved memory.
- Free. Free memory.
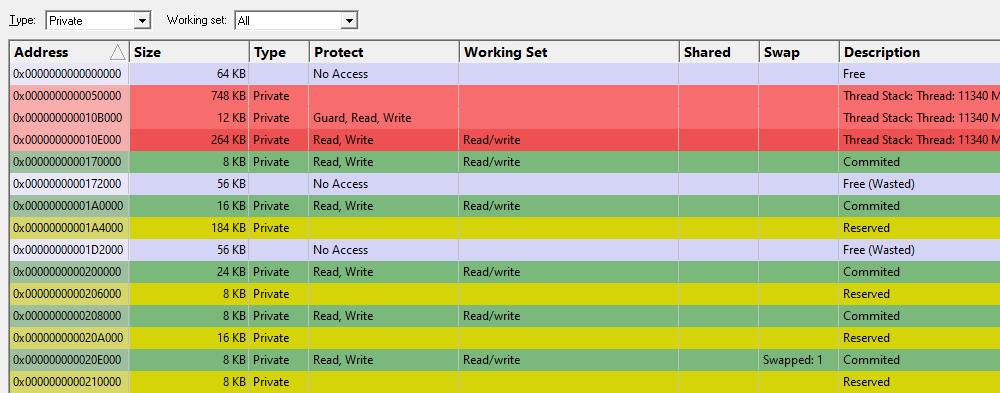
- Private. Memory private to this application.
- Image. Executable files (EXE, DLL, etc.).
- Mapped. Memory-mapped files.
- Stack. Memory used for thread stacks.
- Shareable. Memory is shared with other applications.
- Swapped. Memory swapped in/out of memory.
- Wasted. Memory allocated by VirtualAlloc() but not available to the application to use.
Working Set Filter
- All. Displays all memory.
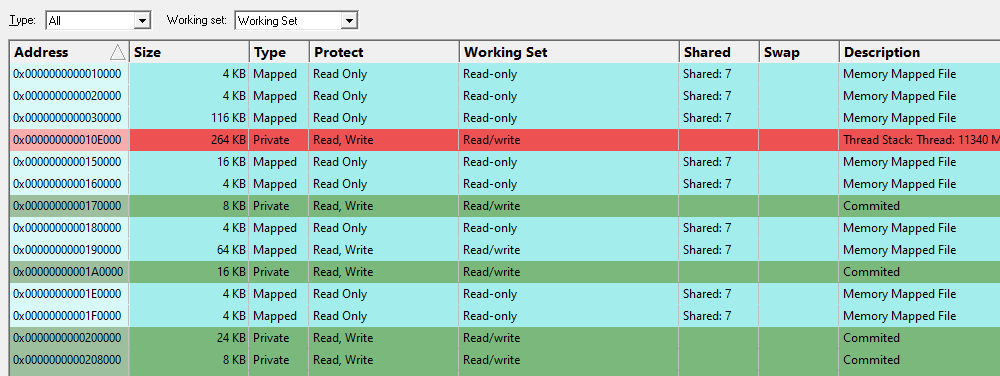
- Working Set. Only displays memory that is in the working set.
- Not Working Set. Only displays memory that is not in the working set.
Offline Analysis
Virtual memory data can be saved and reloaded. This allows you to archive data and send it to colleagues for later inspection and analysis.
The saved file contains all virtual memory information, DLL names, symbol names, filenames and page fault information that was current when the file was saved.
Minidumps
Minidumps often contain useful memory information. Traditional minidump tools don’t allow you to view the memory layout described by the minidump. Virtual Memory Validator shows you that information. Load your minidump via the File menu.
If you’d rather generate a minidump than save a VM Validator session file, you can save a minidump of the currently executing application from the file menu.
Wasted Memory
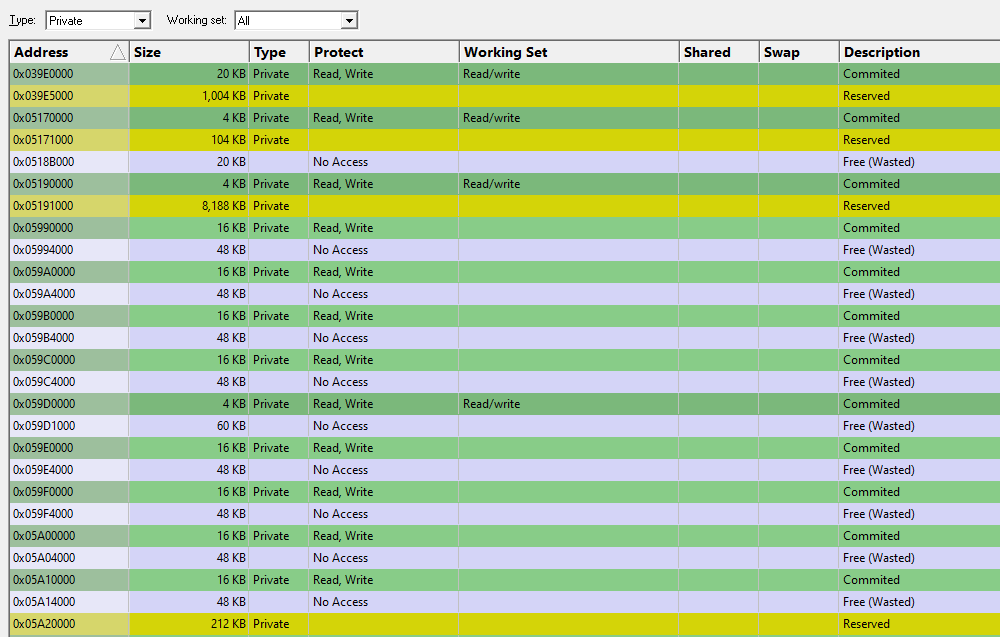
VM Validator reports wasted memory as a special category of free memory. Wasted memory happens when VirtualAlloc() is used to allocate a memory block that is not a multiple of the minimum allocation size used by VirtualAlloc(). This typically results in the block requested by the caller and a wasted block following that block that is implicitly created with memory protection type PAGE_NO_ACCESS.
If you’re allocating memory directly from VirtualAlloc() rather than a dedicated heap (CRT, HeapAlloc), you can very quickly create some memory leaks without even realising it.
You can check for wasted memory and any possible memory leaks by looking for any memory allocation patterns involving wasted memory. The image below shows a filter set for private memory showing committed memory followed by wasted memory. These are possible memory allocations that could be improved by the use of a dedicated memory heap rather than direct calls to VirtualAlloc().
We’ve written an in-depth exploration of how VirtualAlloc() can cause wasted memory.
Command line
Example 1 Monitor an already running process.
vmValidator.exe /process 1344
Example 2 Launch an application.
vmValidator.exe /program e:\om\c\test\release\test.exe
                /dir e:\om\c\test\release
                /arg "the cat sat on the mat"
                /arg speak
Example 3 Load a previously saved session.
vmValidator.exe /session e:\om\c\test\release\test.vvm
Example 4 Load a minidump.
vmValidator.exe /minidump e:\om\c\test\release\test.dmp
Usage
You can use VM Validator in seven ways:
- Monitor an already running executable.
- Specify an executable to start, and VM Validator will monitor that executable.
- Specify an executable to watch; VM Validator will wait for the executable to start, and then VM Validator will monitor that executable. This feature is very useful for monitoring child processes or OLE servers that start when a document is opened inside a 3rd party application.
- Load a minidump to inspect the memory layout of an application at the time of the minidump.
- Load a memory snapshot to inspect the memory layout of an application at the time of the memory snapshot.
- Save memory snapshots to load and inspect later or inspect on another machine (take a snapshot on the customer machine, and view it in your office using VM Validator).
- Save a minidump to load and inspect later or inspect on another machine (save a minidump on the customer machine, and view it in your office using a debugger, VM Validator or Minidump Browser).
VM Validator does not require your application to be recompiled or relinked.
More about Virtual Memory Validator
Page Fault Tools
We also provide this page fault tool: