Minidump Manager
Minidump Manager is a software tool for managing collections of minidumps.
Minidumps are written when an application crashes, and written when an application specifically causes them to be written for diagnostic purposes (a snapshot of program activity).
Minidumps are stored in different places depending on why they are written.
- Most crash minidumps will be written in the user’s crash dump area: c:\Users\user-name\AppData\Local\CrashDumps.
- Custom location for logging activity.
If you’re collecting minidumps for later analysis it can be overwhelming trying to work out what is contained in each minidump. You can name them, or store them in specific directories to help you manage them, but this assumes you know what each minidump represents.
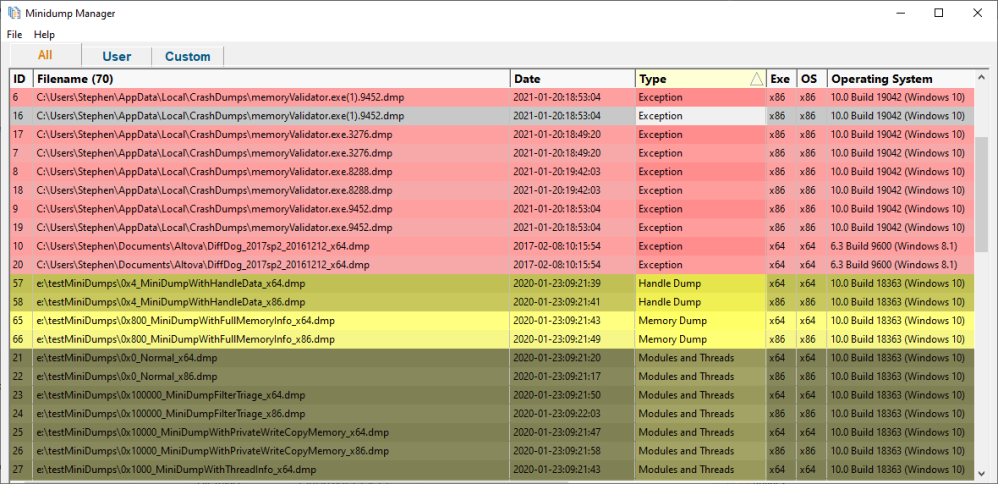
Minidump Manager takes the guess work out of this. The simple to read display tells you which Operating System, which architecture, what type of data is contained in the minidump (exceptions, handles, memory, …), summary information about any exception present and how many user defined streams.
We’ve grouped minidumps into three broad categories.
- All. Every minidump found when scanning your machine.
- User. All minidumps found in the computer user hierarchy (typically c:\users).
- Custom. All minidumps not in “User”.

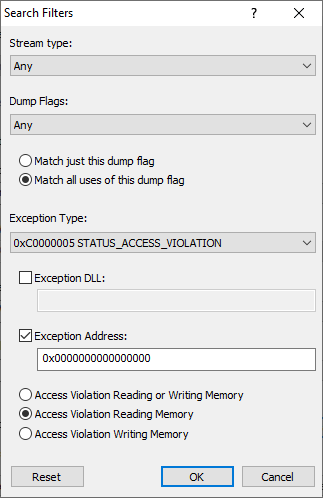
Minidump Filters
When scanning for minidumps you can setup filters to restrict the results per minidump type, per exception type, per exception DLL, etc.

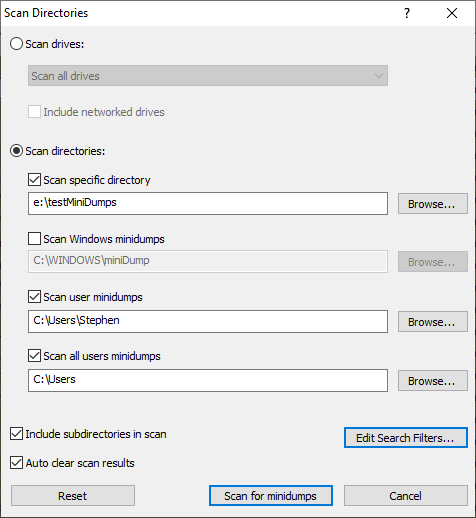
File Filters
You can also scan multiple directories, with some pre-configured with common locations where minidumps may be found.

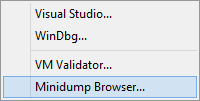
Minidump inspection
Having selected a minidump of interest you can then load it into Visual Studio, WinDbg, Virtual Memory Validator or Minidump Browser via the context menu.
