Memory Validator Tutorials

The Tutorials

How to detect memory corruption (tools) using Memory Validator

How to detect memory corruption (instrumentation) using Memory Validator

How to detect memory corruption (memory reuse) using Memory Validator

How to detect calling methods on deleted objects using Memory Validator

How to detect uninitialised data using Memory Validator

How to detect broken message maps using Memory Validator
Detecting Memory Corruption (tools)
Memory Validator provides a variety of functions that will aid you in detecting the cause of memory corruption in your application. Some of the functionality only applies to the _DEBUG version of your application, the remaining functionality applies to both _DEBUG and Release versions of your application.
- Example error to detect
- C runtime library
- Heap Scan
- Integrity Check
- Memory Buffer Overflow Detection
- Analysis Tab
- Address Query
Example Error
A common problem when writing C or C++ programs is memory corruption. Memory corruption can happen inside memory blocks allocated on the C runtime heap, other heaps, or on the stack. Memory corruption can also happen in the workspace used by the heap manager to manage the allocations in the heap.
It is not possible to detect memory corruption that happens in memory that has been allocated, or memory on the heap, as the memory corrupted is memory that is valid for reading and writing.
It is possible to detect memory corruption for the memory used to manage the C runtime heap, other heaps and the callstack space that is not used for parameter passing and local variable storage.
Corruption of the _DEBUG C runtime heap workspace is often revealed as error messages printed to the Developer Studio output window that say
Damage before normal block at 0xhhhhhhhh.
or
Damage after normal block at 0xhhhhhhhh.
where 0xhhhhhhhh is a hexadecimal address. Corruption of the _DEBUG C runtime heap often leads to a crash, but not always immediately. Corruption of the Release C runtime heap is usually revealed as a crash as the heap structure is more compact and corruption damages more data items. Corruption of the heaps created by HeapCreate() usually results in messages to the output window and breakpoint exceptions thrown in kernel32.dll, sometimes resulting in a crash of the application.
C runtime library
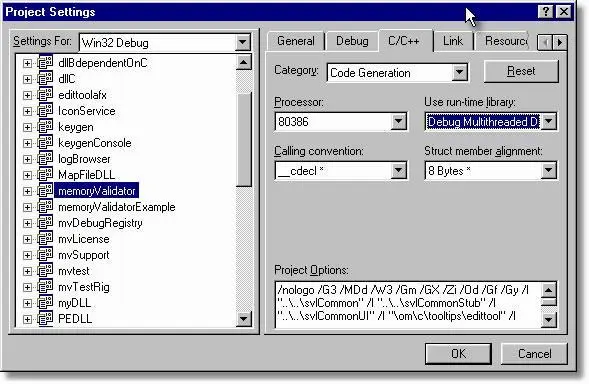
The first thing to check is that all your DLLs, libraries and your executable, are linked with the dynamic C runtime library MSVCRT(D).DLL or its numbered equivalent (MSVCRT70.DLL, etc). If you have a DLL that is statically linked to the C runtime library (LIBCMT(D).DLL or LIBC(D).DLL) Memory Validator will not be able to check any memory allocated in that DLL for corruption or other errors.
To use the dynamic C runtime library choose the multithreaded DLL option in your C++ code generation options in Visual Studio, as shown below.
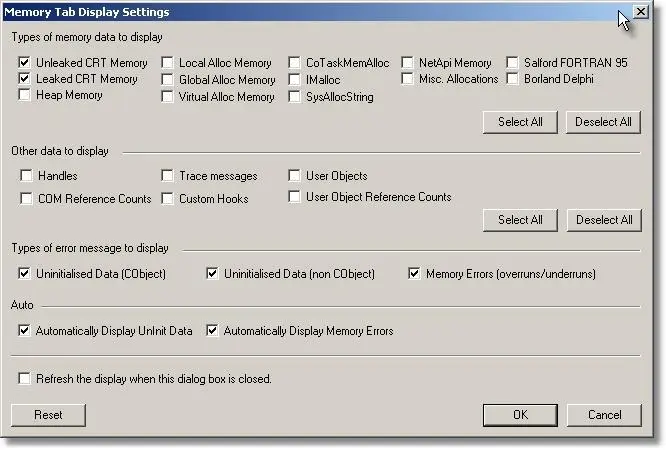
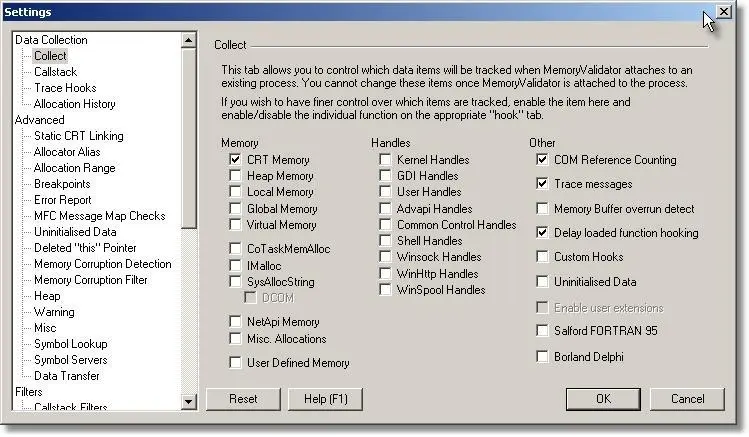
You will also need to select the appropriate options to collect C runtime heap data and to display C runtime heap data. The pictures below show the appropriate options selected on the memory tab settings dialog and in the main settings dialog when in expert mode.
Heap Scan
The C runtime library only checks for memory corruption before and after blocks of memory in the _DEBUG version of your application. In addition, these checks are only made when you call a C runtime function to allocate some memory (malloc, calloc, realloc, free, new, delete, etc). The default is to check just the current entry in the heap, although you can change this using _CrtSetDbgFlag().
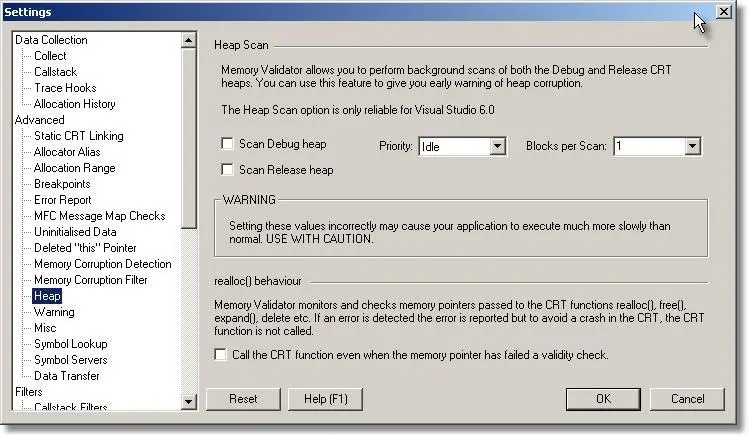
Memory Validator allows you to perform a scan of the heap whilst your application is running. The scan runs in its own thread and can scan heaps in _DEBUG and Release versions of your application. You can choose how much processor time the scan gets by changing the thread priority and how many heap blocks are scanned during each scan.
The picture below shows configuration options for the heap scan, together with options for controlling if a dialog box is displayed when an error is found, or if a debugger breakpoint should be triggered when an error is found.
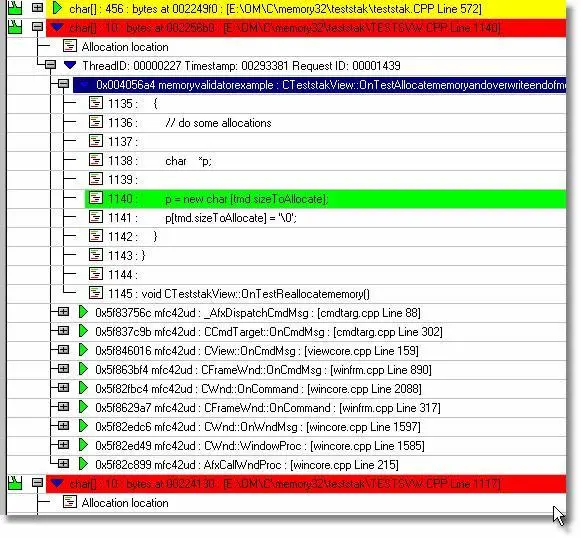
When a scan finds a block that has been corrupted, the user interface is informed and the block is marked as damaged and is displayed on the memory tab as shown in the picture below.
In the example below, damaged blocks are shown in red. The example shows the damage happening in the very next line after the allocation, as a terminating byte for a string is written past the end of the string buffer.
A consequence of the scan happening in a separate thread is that if the scan has a low priority, not all blocks will be scanned before they are deallocated. However if the scan has a high priority, allocations blocks will be scanned between calls to the C runtime heap manager, thus increasing the likelihood that the scan will find which block is corrupted between calls. Note that the higher the priority and the more blocks that are checked each scan, the slower your application will execute.
Integrity Check
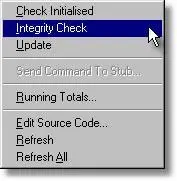
If you do not wish to use the heap scan, the heap integrity check is a useful tool. You can invoke a heap integrity check from the tools menu or toolbar, shown below.
![]()
The heap integrity check checks all C runtime heap allocations in the _DEBUG heap to test if any allocations have been damaged. If a memory block has been damaged before or after the block in the 4 byte gaurd region that surrounds each allocation, the memory block location is sent to the user interface and the block is marked as damaged. When the integrity check is complete, Memory Validator refreshes the display and any damaged blocks will be displayed in the damaged colour (default is ref) on the Memory tab. Note that depending on the options you have selected to display data, any damaged items may not be in view and you will need to scroll up or down to view them.

Memory Buffer Detect
If you think the cause of the memory corruption may be one of the many string and buffer manipulation functions provided by the C runtime and Win32 API functions, you can enable Memory Validator’s buffer overflow detection functionality.
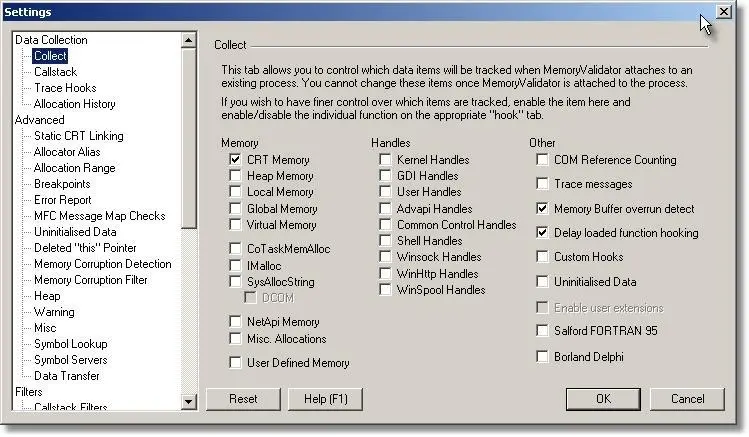
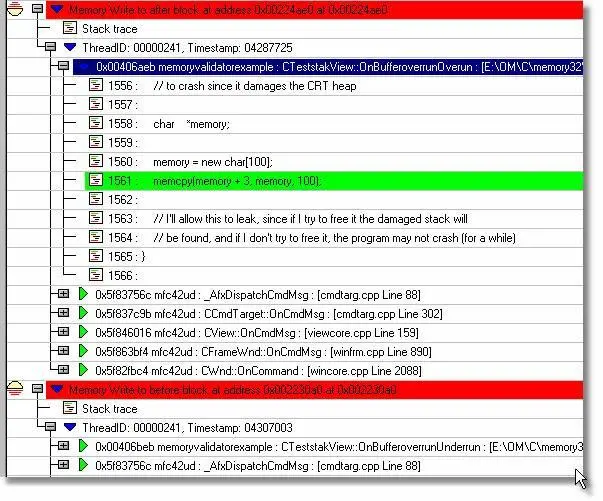
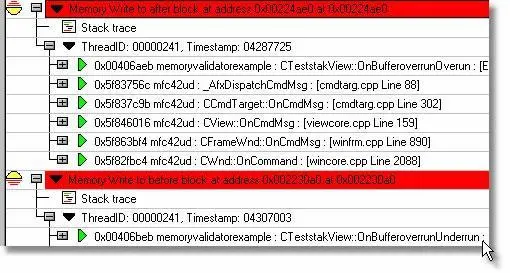
The buffer overflow detection detects buffer overflows and underflows in _DEBUG C runtime heap memory, memory allocated by HeapAlloc() and HeapRealloc(), stack frame underwrites and stack frame overwrites. The picture below shows a buffer overflow and a buffer underflow, both caused by incorrect arguments to the C function memcpy().
Analysis Tab
The Analysis tab provides analysis facilities to allow you to identify memory allocations related to memory blocks that Memory Validator has identified as damaged (corrupt). Click the Damaged button to display all damaged blocks.
The Analysis tab provides analysis facilities to allow you to identify memory allocations related to memory blocks that Memory Validator has identified re-used. Click the Memory Reuse… button to display all memory blocks that have been reallocated and/or freed and subsequently reused in another allocation later in the application’s lifetime.
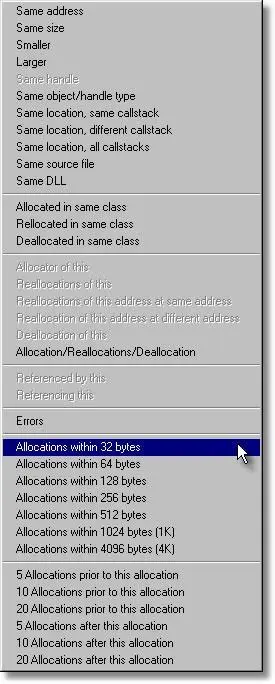
Select a damaged block that is of interest and right click to display the context menu. The menu contains many options allowing you to display related blocks. The image shows the mouse cursor over the options to show other memory blocks within an address range so that you can detect possible data offset errors when accessing arrays and structures. Alternatively you may want to check allocations that happened in close proximity to the corrupt block.
Address Query
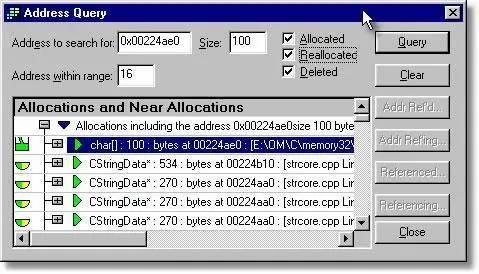
If you know the address of a damaged block of memory, you can use the Address Query dialog to identify blocks that are within a given threshold of the damaged block. This applies to blocks that have been reallocated or freed, so you can identify possible writes to blocks that have been discarded and then reused, but to which a pointer is still pointing (incorrectly) and thus damaging your application’s data.
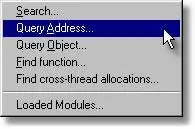
The Address Query dialog can be displayed from the Query menu or toolbar, shown below.
![]()
Type the address of memory block of interest (leading 0x for hexadecimal, otherwise decimal is assumed), its size and the data threshold and click the Query button. All data that falls within the specified address range will be displayed. If the application is still executing the four buttons on the right hand side are enabled and allow you to query which objects are refering to each other via pointers found inside each object. The picture shown below has the buttons disable because the application is no longer executing so the pointers cannot be queried.
