Memory Validator Tutorials

The Tutorials

How to detect memory corruption (tools) using Memory Validator

How to detect memory corruption (instrumentation) using Memory Validator

How to detect memory corruption (memory reuse) using Memory Validator

How to detect calling methods on deleted objects using Memory Validator

How to detect uninitialised data using Memory Validator

How to detect broken message maps using Memory Validator
Detecting Memory Corruption (instrumentation)
In addition to the functions discussed in part1, Memory Validator provides explicit functionality for detecting Memory Corruption. When used with care, this functionality can allow you to identify memory corruption very quickly. When used carelessly, this functionality will be very slow, probably too slow to provide any meaningful results.
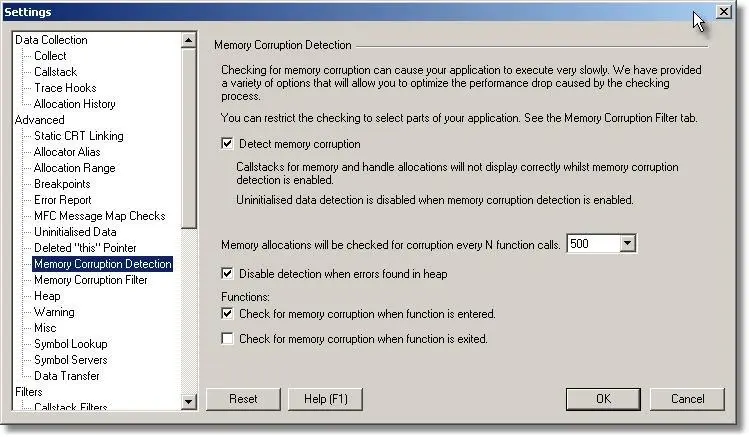
Using the Memory Corruption Detection tab on the setting dialog:
- Select the Detect Memory Corruption check box.
- Select how often to check for memory corruption. Selecting a lower number causes checks to happen more often. Initially, we want a larger number.
- Select the check box to stop memory corruption detection when errors are found. If you don’t check this check box, Memory Validator will continue checking for memory corruption. Typically once you find a memory corruption, there is no value in continuing to search for memory corruptions as you have found a serious error in your application, and many data items could be damaged, leading to FALSE indicators.
- Select one, or both, of the check boxes for checking for memory corruption when entering and exiting a function. Selecting both will make the memory corruption detection twice as slow. Initially, just select the check box for entering the function, and de-select the check box for exiting the function.
Your options should look like the image shown:
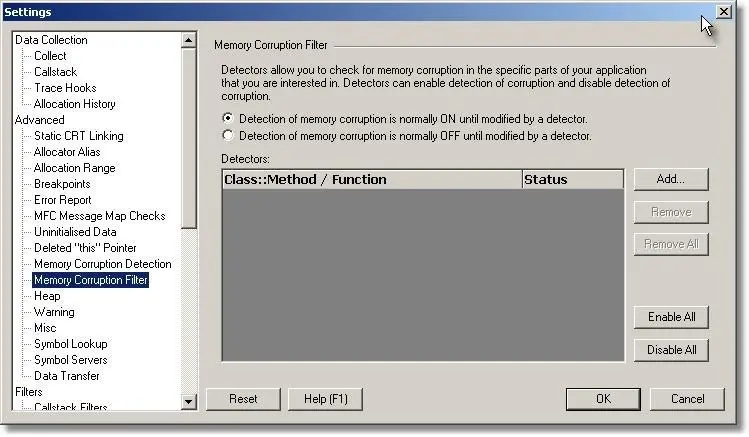
Using the Memory Corruption Filter tab on the setting dialog:
- Remove all entries from the list by clicking the Remove All button.
- Select the first radio box, so that the default is “ON”.
Your options should look like the image shown:
Using the options selected we will now perform a test which will identify a memory corruption. Based on the data shown, we will demonstrate how to isolate the error location to the line in which the error occurs without incurring a heavy performance penalty.
Step 1
Step 1 focuses on a getting a broad brush picture of where the corruption happens in your application.
- Select CRT data collection on the Collect tab of the settings dialog, and CRT data display on the Memory tab display settings dialog.
- Start nativeExample.exe as the test application. The Memory Validator injection process will show the hooking of each function in each DLL. Please wait whilst these hooks are inserted.
- Using the Memory Errors menu, select the Memory Corruption submenu, then choose Allocate memory and overwrite end of memory.
- At this point memory is corrupted and Memory Validator has a location for the “last known good state of the CRT heap. We will use nativeExample.exe until Memory Validator identifies the memory corruption. At this point Memory Validator will update the error display to show the memory corruption. Choose the Help menu and click About nativeExample…. Memory Validator should have detected the memory corruption by now.
- When the memory corruption is identified, Memory Validator updates the display to show the following data:
- Indicate the location at which the memory was allocation, and that is has been corrupted. This item is displayed in red to indicate damaged memory. If you have not had CRT data collection enabled, this entry will not have a callstack.
- Indicate the last know location at which Memory Validator identified a non-corrupt CRT heap.
- Indicate the location at which Memory Validator identified the CRT heap as corrupt.
An example display is shown:
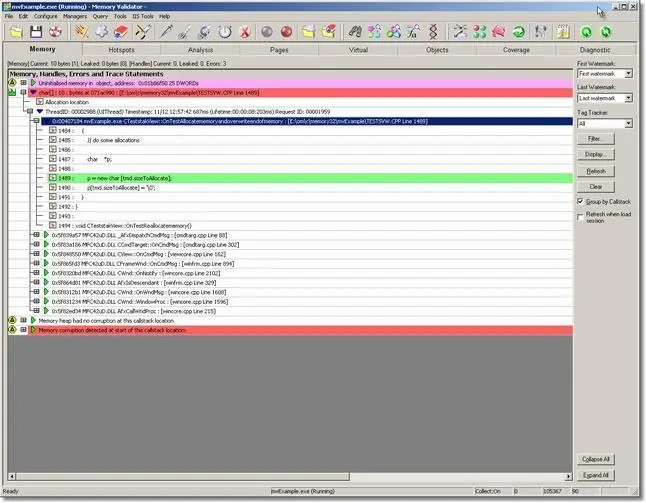
Using the information displayed you know that the data corruption happened between the last known good location and the location at which the memory was identifed as corrupt. The next process is to increase the frequency of the corruption checks whilst at the same time filtering the corruption checks so that corruption checks are only performed on likely parts of the application.
Step 2
Step 2 repeats Step 1, but with specific focus on parts of the application. For our trivial application we can tell that the corruption seems to be associated with one specific C++ class, CTeststakView. The reason for this is that the memory allocated is managed by CTeststakView.
For your application, you may identify several classes which may be candidates for causing the memory corruption. Once you have identified the initial class candidates, you can enter these class names into the Memory Corruption Filter, as shown below. The callstacks for “allocation location”, “last know good” and “corrupted location” will give you clues as to which classes are appropriate for you to add the Memory Corruption Filter.
Note the changes to the filter shown above:
- The default has been to turn all detection OFF until modified by a filter. This option greatly improves the speed at which detection is performed, as only the specified functions are checked. However to coincide with this, we need to reduce the frequency value on the Memory Corruption tab.
- A filter has been added that will turn detection on for all methods in the class CTeststakView. The class name must be spelt correctly (correct capilatisation). Specifying a method is done by specifying ClassName::MethodName.
Combined with the tighter focusing of specific methods, we can increase the frequency at which checks are performed, as demonstrated by the new values shown in the Memory Corruption tab, shown below.
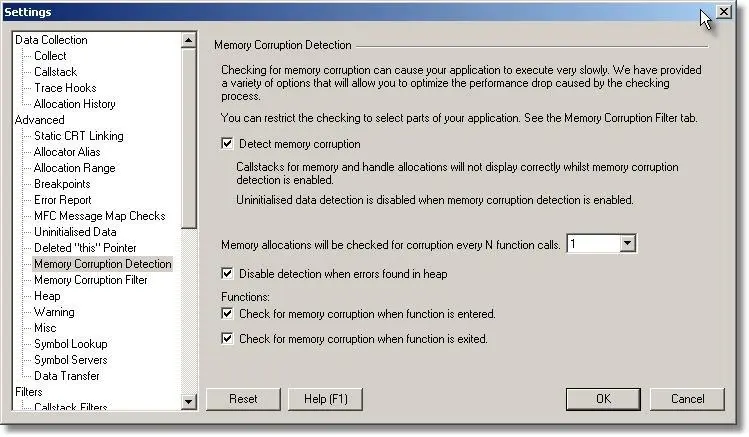
If we repeat the test run from Step 1, with the above settings, Memory Validator identifies the function corrupting memory and displays the data on the Memory tab.
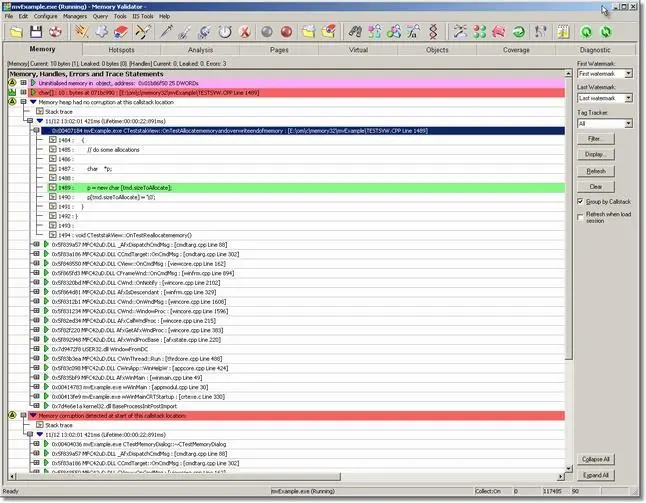
In this example, we focused on the correct class and reduced the frequency to 1 very rapidly. However, the test application is not typical of a real application, it is smaller and less complex. In a real application you will need to refine you choice of filter classes and reduce the detection frequency number on each iteration until you identify the corrupting function.
Sensible choices of which classes (and methods – see the help file for how to filter on methods) to filter and how often to test should reduce the number iterations required to identify the memory corruption.
Step 3
Typically when trying to detect memory corruption, once the corruption location is known, the test can stop. There is no value in closing the application normally as the application’s data is corrupt. Click the red X on the toolbar to kill the application immediately. Note that when killing the application this way, the session recorded by Memory Validator is discarded – be sure to make note of the information you need before killing the application this way.

If you choose to close the application normally be aware that this may take longer than usual because all the memory corruption hooks will still be installed and will be checking for memory corruption during your application’s shutdown period.
Finally, disable Memory Corruption Detection when you are finished using it.