Performance Validator Tutorials

The Tutorials

Getting Started

Why is Profiling Important?

Types of profiling: Sampling and instrumentation.

Callstack

Statistics and Relations.

Call Tree

Call Graph

Analysis

Line Timing

How to restrict instrumentation to specific parts of your application.

How to exclude profiling MFC for statically linked and dynamically linked applications.

How to profile only selected parts of your application.

How to improve instrumentation speed.

Customizing embedded statistics.

Identifying slow code.

Reseting statistics.

Using Stop and Start.

Performance profiling a .Net Core application

Performance profiling a .Net Core application child process

Performance profiling a service

Performance profiling for a service child process

Performance profiling an IIS ISAPI DLL

Performance Profiling ASP.Net with IIS

Performance profiling ASP.Net with Web Development Server

Command Line Performance Profiling a Child Process
Statistics
This tutorial demonstrates launching the sample application and inspecting the statistics gathered during the application’s execution. The tutorial demonstrates how to use the statistics-related views provided by Performance Validator.
Performance Validator provides two statistics views:
- Statistics. This view provides timing and visit count statistics for individual functions.
- Relations. This view provides timing and visit count statistics and provides information on the functions calling a particular function and functions called by a particular function.
All three views allow you to view the source code of each function at the same time, with optional embedded timing and visit count statistics.
Sampling
This tutorial will demonstrate the statistics gather using sampling mode.
- Click on the settings icon on the toolbar.

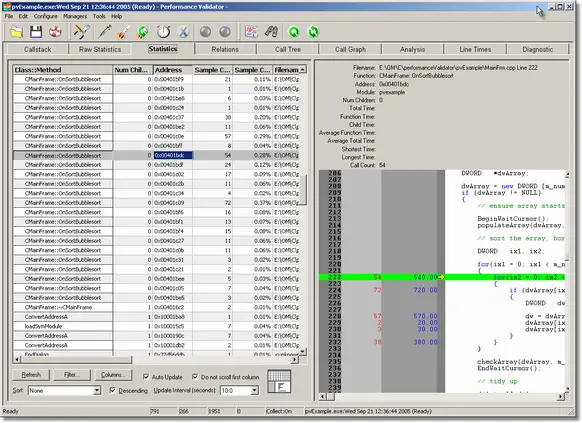
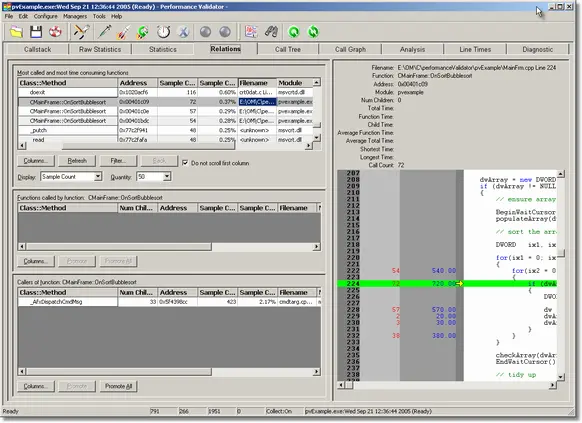
The settings dialog is displayed. On the Performance tab, choose the Sampling option – this ensures Performance Validator doesn’t spend time instrumenting your application – allowing for a rapid attachment to the application to enable you to get a quick view of the callstack when your application is under load. Click OK to accept the new settings.Note that the displays for the statistics will show sample count related data (Class, Method, Class and Method, Num Children, Address, Sample Count, Sample Count %, Filename, Module). You can configure which statistics to view using the Columns… button. - Launch the sample application. Click on the relaunch icon on the toolbar to relaunch the most recently launched application.

- Using the sample application, select the Sort menu and choose Quick Sort.
- Using the sample application, select the Sort menu and choose Comb Sort.
- Using the sample application, select the Sort menu and choose Heap Sort.
- Using the sample application, select the Sort menu and choose Merge Sort.
- Using the sample application, select the Sort menu and choose Bubble Sort.
- Close nativeExample.exe using the File menu Exit command. The application closes. Performance Validator processes any remaining data and displays the final results.
- Select the Statistics tab and click Refresh. Statistics for all calls are shown. Click on a statistic to display the source code corresponding to that statistic. The data can be sorted by clicking on the column heading.

- Select the Relations tab and click Refresh. Statistics for all calls are shown. Click on a statistic to display the source code corresponding to that statistic and any related calls. The data can be sorted by clicking on the column heading. You can also select data in the lower two panes (the callers and callees) – this will cause the source code for those statistics to be displayed.

Instrumentation
This tutorial will demonstrate the statistics gather using instrumentation mode.
- Click on the settings icon on the toolbar.

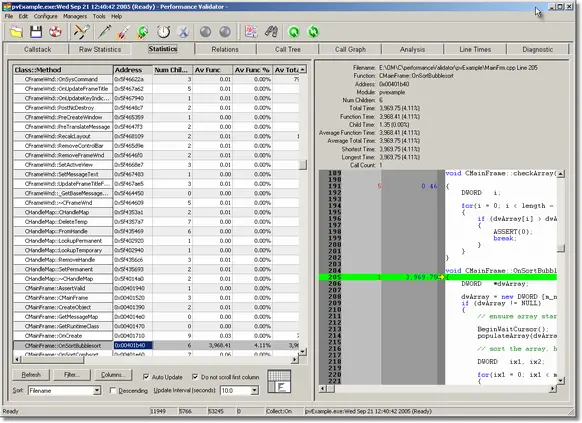
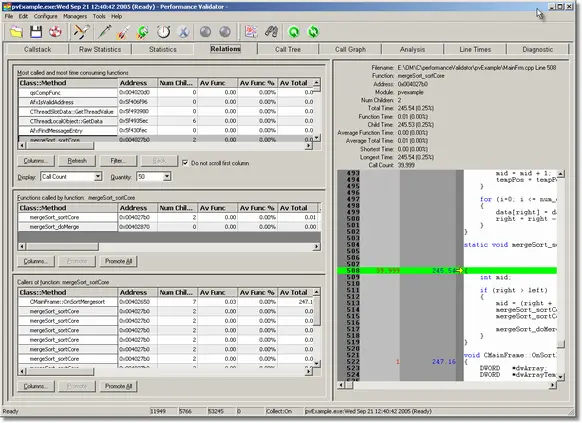
The settings dialog is displayed. On the Performance tab, choose the Time Stamp Counter option. This option causes Performance Validator to instrument your application and to time various operations using the processor’s time stamp counter. If you do not want to use the time stamp counter you can choose one of the other instrumentation options. Instrumented code runs slower than sampled code as it is executing more code to perform the timing of each function. However instrumented code allows Performance Validator to gather more information about each function. Click OK to accept the new settings.Note that the displays for the statistics will show instrumentation related data (Class, Method, Class and Method, Num Children, Address, Average Time, Average Time %, Call Count, Call Count %, Function Time, Function Time %, Children Time, Children Time %, Total Time, Total Time %, Longest Time, Longest Time %, Shortest Time, Shortest Time %, Filename, Module). You can configure which statistics to view using the Columns… button. - Launch the sample application. Click on the relaunch icon on the toolbar to relaunch the most recently launched application.

- Using the sample application, select the Sort menu and choose Quick Sort.
- Using the sample application, select the Sort menu and choose Comb Sort.
- Using the sample application, select the Sort menu and choose Heap Sort.
- Using the sample application, select the Sort menu and choose Merge Sort.
- Using the sample application, select the Sort menu and choose Bubble Sort.
- Close nativeExample.exe using the File menu Exit command. The application closes. Performance Validator processes any remaining data and displays the final results.
- Select the Statistics tab and click Refresh. Statistics for all calls are shown. Click on a statistic to display the source code corresponding to that statistic. The data can be sorted by clicking on the column heading.

- Select the Relations tab and click Refresh. Statistics for all calls are shown. Click on a statistic to display the source code corresponding to that statistic and any related calls. The data can be sorted by clicking on the column heading. You can also select data in the lower two panes (the callers and callees) – this will cause the source code for those statistics to be displayed.
