Performance Validator Tutorials

The Tutorials

Getting Started

Why is Profiling Important?

Types of profiling: Sampling and instrumentation.

Callstack

Call Tree

Statistics and Relations.

Call Graph

Analysis

Line Timing

How to profile only selected parts of your application.

How to exclude profiling MFC for statically linked and dynamically linked applications.

How to restrict instrumentation to specific parts of your application.

How to improve instrumentation speed.

Customizing embedded statistics.

Identifying slow code.

Reseting statistics.

Using Stop and Start.

Performance profiling a .Net Core application

Performance profiling a .Net Core application child process

Performance profiling a service

Performance profiling for a service child process

Performance profiling an IIS ISAPI DLL

Performance Profiling ASP.Net with IIS

Performance profiling ASP.Net with Web Development Server

Command Line Performance Profiling a Child Process
Customizing Embedded Statistics
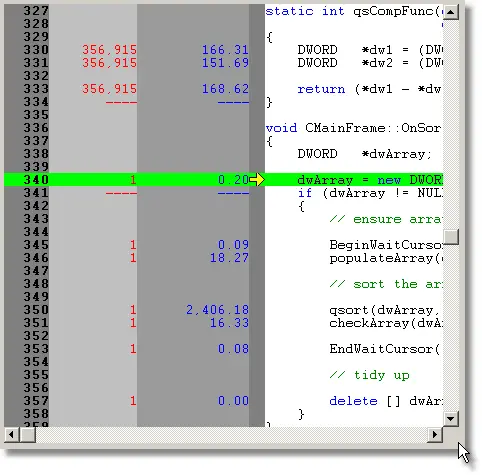
Performance Validator provides a syntax-coloured source code viewing pane to allow the source code associated with a given statistic to be viewed. Most of these source code viewing panes provide the option to include embedded statistics. An example image is shown below:

The red statistics indicate the number of visits, the blue statistics indicate the amount of time.
Depending on your needs and the application under test, you may or may not want these statistics displayed. Additionally you may want the statistics displayed according to your own preferences, more or less columns, use of separators and different colours.
- Open the settings dialog by clicking the tools icon on the toolbar.

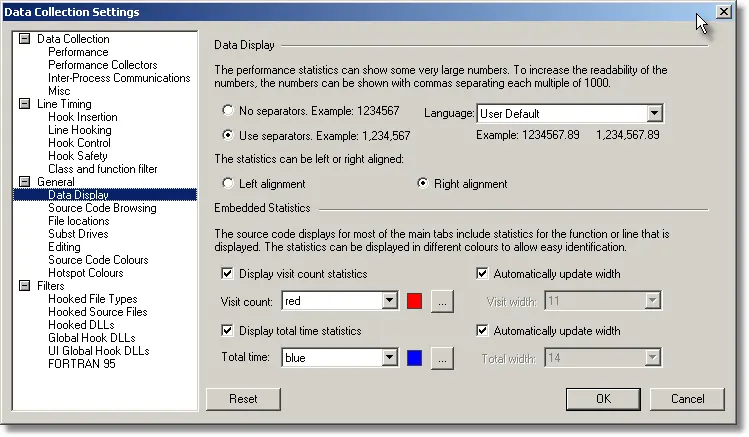
- The Settings Dialog is displayed. Select the Data Display tab.

- To turn the display of separators on or off choose the Use separators or No separators radio box.
- To display the statistics left or right aligned, choose the Left alignment or Right alignment check boxes.
- To display or hide the visit count statistics, select or deselect the Display visit count statistics check box. Choose the colour and column width as appropriate.
- To display or hide the total time statistics, select or deselect the Display total time statistics check box. Choose the colour and column width as appropriate.
- Click OK to accept the settings. All source code displays will be updated to display the embedded statistics as appropriate.