Thread Validator Tutorials

The Tutorials

Getting Started

User Interface Mode

How to interpret the thread validator displays

Analysing an Application

Good Lock Strategy

Deadlock using two threads

Potential deadlock caused by incorrect locking strategy.

Potential deadlock caused by an infinite wait.

Leaving an unlocked critical section.

Deleting a locked critical section.

Leaving a critical section in the wrong order.

Identifying deadlock objects when not collecting callstacks.

Analysing an existing deadlocked application.

Getting information about a threading error.

Detecting deadlocks in a child process

Detecting deadlocks in a service

Detecting deadlocks in a service child process

Detecting deadlocks in an IIS ISAPI DLL

Command Line Deadlock Detection in a Child Process
Deadlock using two threads
This tutorial demonstrates using Thread Validator to monitor an application before and after part of the application deadlocks. The techniques in this tutorial are demonstrated using two threads for ease of understanding. However, the techniques are applicable to any number of threads.
Note that for your executing nativeExample your critical section addresses, thread Ids and sequence numbers will all be different. We have used the values that we experienced to write this tutorial. Substitute your own values where appropriate.
-
- Launch the sample application. Click on the re-launch icon on the toolbar.

- The previously launched application is started.
- From the Test menu, choose the Two thread deadlock submenu, then choose Start Deadlock Thread 1. Notice that the nativeExample user interface shows a counter incrementing.
- From the Test menu, choose the Two thread deadlock submenu, then choose Start Deadlock Thread 2. Notice that the nativeExample user interface shows a second counter incrementing.
- After a while both counters will stop incrementing. This is caused by a coding error in how the two threads interact. The coding error has lead to a thread deadlock, where each thread holds one lock and is attempting to acquire a second lock which is held by the other thread.
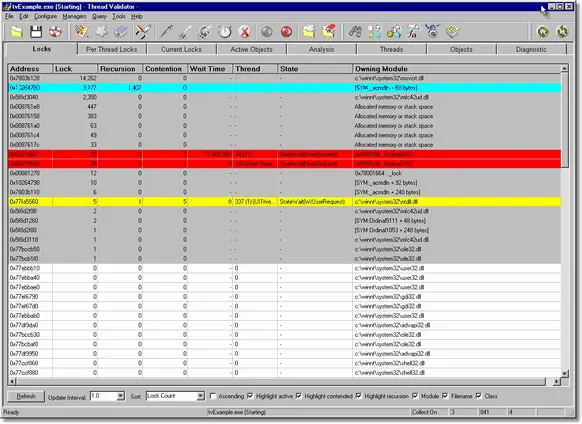
- Viewing the Locks tab will show two critical sections in bright red, both having a thread state of StateWait(UserRequest). This indicates the critical sections are involved in a deadlock.
- Launch the sample application. Click on the re-launch icon on the toolbar.
Using the Per Thread Locks tab, right click on the entry for each deadlocked critical section. A context menu will be displayed.
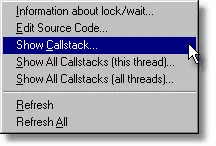
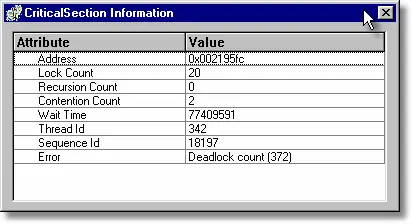
Choose Information about lock/wait…. A modeless dialog containing information about the lock is displayed.
-
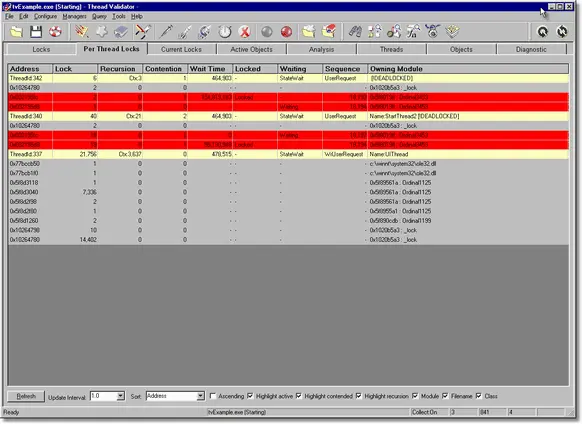
- Viewing the Per Thread Locks tab will show all application threads, two of which will each have two critical sections highlighted in bright red, both having a thread state of StateWait(UserRequest). This indicates the critical sections are involved in a deadlock.
- Viewing the Current Locks tab will show two threads, both of which will have two critical sections highlighted in bright red, both having a thread state of StateWait(UserRequest). This indicates the critical sections are involved in a deadlock.
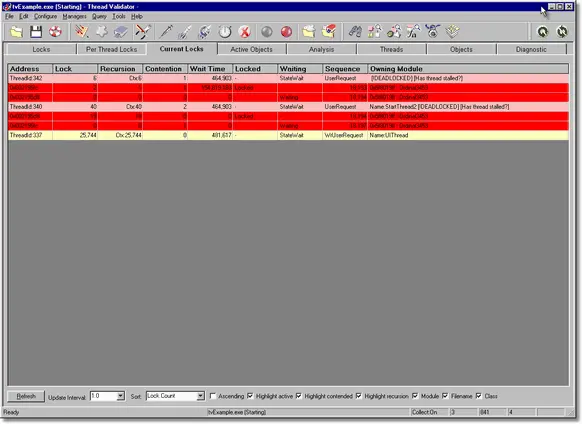
- Using the information from either of the three tabs indicates the application has some threads involved in a deadlock. The next thing to do is to determine how the deadlock happened.The first action is to take a note of which threads are involved in the deadlock, which critical sections are locked by these threads and the sequence ID for that locked critical section, which critical sections are being waiting upon by these threads and the sequence ID for that waiting critical section. With this information we can identify the order in which the locks were acquired/waited upon.
- Viewing the Per Thread Locks tab will show all application threads, two of which will each have two critical sections highlighted in bright red, both having a thread state of StateWait(UserRequest). This indicates the critical sections are involved in a deadlock.
For the example shown above, the information is most readily acquired from the Per Thread Locks tab. The information is:
| Thread Id | Critical Section | Sequence | Locked |
|---|---|---|---|
| 342 | 0x002195fc | 18193 | Locked |
| 342 | 0x002195d8 | 18194 | Waiting |
| 340 | 0x002195fc | 18197 | Waiting |
| 340 | 0x002195d8 | 18194 | Locked |
Sorting this by sequence ID and lock status (where Locked has priority over Waiting when sequence IDs are identical), we get:
| Thread Id | Critical Section | Sequence | Locked |
|---|---|---|---|
| 342 | 0x002195fc | 18193 | Locked |
| 340 | 0x002195d8 | 18194 | Locked |
| 342 | 0x002195d8 | 18194 | Waiting |
| 340 | 0x002195fc | 18197 | Waiting |
The above table can be displayed by choosing the Display Lock Order entry on the Query menu. An example is shown below:
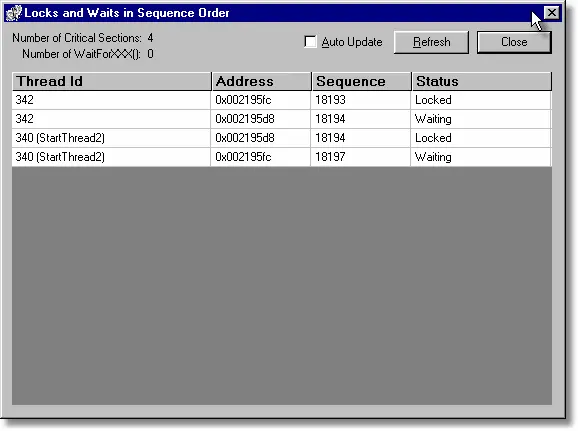
This information demonstrates that the locks were acquired in one order in Thread 340 and a different order in thread 342. Good multi-threading requires that locks are acquired in the same order. This is the cause of the deadlock. One of the threads needs to be modified to acquire the locks in the same order as the other thread.
We can see from the Owning Module column the source code location – however in this case it is in an MFC inline header file (afxmt.inl) which indicates the code is inside a CCriticalSection object. This is not very useful information for identifying which code called the Lock() method on the critical section object. We require a callstack for this method call.
Using the Per Thread Locks tab, right click on the entry for each deadlocked critical section. A context menu will be displayed. Choose Show Callstack…. A modeless dialog displays the callstack for the lock. Expanding the callstack allows you to drill down to the source code. As you can see from the image, this thread is acquiring the locks in the order sect1_a, sect2_a.
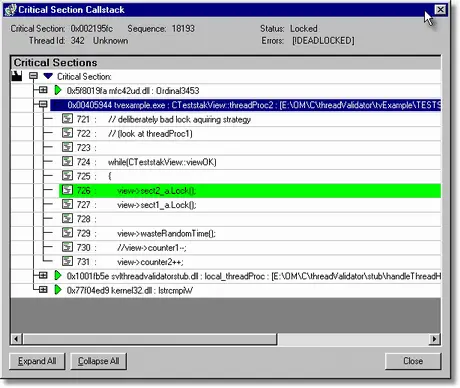
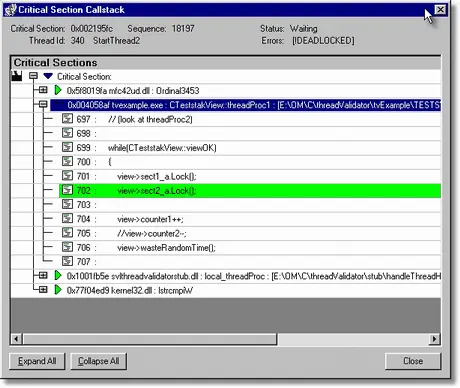
Inspecting the source code for the other thread will show the order the locks were acquired for that thread. As you can see from the image below the data in the table above is correct – the locks are acquired in a different order to the first thread – resulting in deadlock.
- Close the Application using the File menu’s Exit command.
- The various tabs will display the last known state of the critical sections and waits prior to the application finishing.
- Any errors identified during shutdown will be added to the state for each critical section and the displays updated to reflect this.