Thread Validator Tutorials

The Tutorials

Getting Started

User Interface Mode

How to interpret the thread validator displays

Analysing an Application

Good Lock Strategy

Deadlock using two threads

Potential deadlock caused by incorrect locking strategy.

Potential deadlock caused by an infinite wait.

Leaving an unlocked critical section.

Deleting a locked critical section.

Leaving a critical section in the wrong order.

Identifying deadlock objects when not collecting callstacks.

Analysing an existing deadlocked application.

Getting information about a threading error.

Detecting deadlocks in a child process

Detecting deadlocks in a service

Detecting deadlocks in a service child process

Detecting deadlocks in an IIS ISAPI DLL

Command Line Deadlock Detection in a Child Process
Identifying deadlock objects when not collecting callstacks
For some applications, the overhead of collecting callstacks for every synchronization call is too much – it either causes the application to run too slowly or prevents the race condition that causes the deadlock from occurring. In these situations, Thread Validator can be configured to execute without collecting any callstack information for the synchronization calls related to critical sections and WaitForXXX() calls.
Thread Validator will continue to detect deadlocks and other threading errors. Having detected such an error, how can you identify the object which caused the error without a callstack? This tutorial covers this topic.
First, we must configure Thread Validator appropriately.
- Switch to Intermediate Mode or Expert Mode. Using the Configure menu, choose the User Interface Mode… option. When the user interface mode dialog is displayed, select the Expert radio box and click OK.
- Turn off callstack collection. Open the settings dialog by clicking on the tools icon on the toolbar.

On the Collect tab deselect the options relating to callstacks.
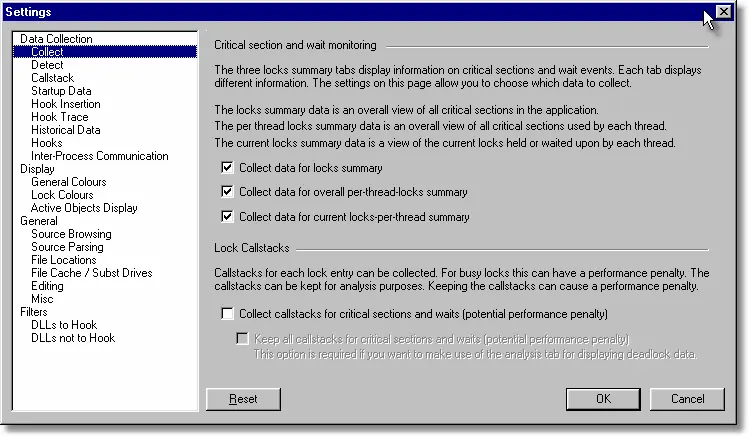
- Turn off out-of-order error detection.
On the Detect tab deselect the Out of order critical sections error detection.
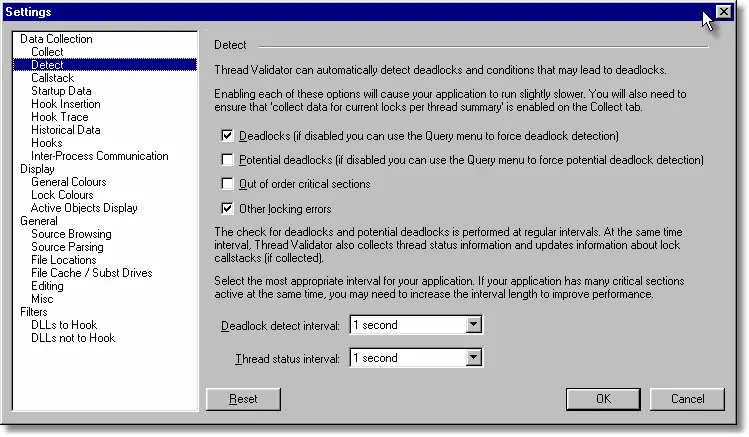
- Turn on waitable handle collection and synchronization collection.
On the Hook Insertion tab select the Functions allocating waitable handles and select the other items shown in the image below.
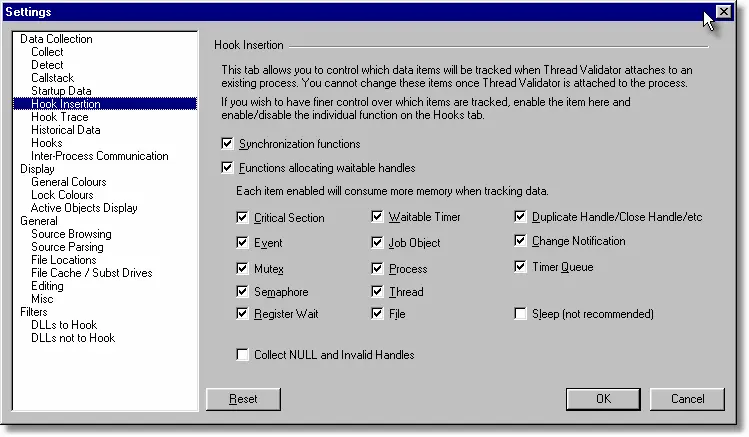 This last option will allow the use of the Active Objects tab and the Query menu to find more information about a synchronization object when a critical section is found that appears to have a threading error.
 - Click OK to accept these settings changes.
Now that Thread Validator is correctly configured for this task, we can start the examples.
Example 1
- Launch the sample application. Click on the re-launch icon on the toolbar.

- The previously launched application is started.
- From the Test menu, choose the Potential deadlock 3 threads.
- Examining the Locks tab, Per Thread Locks tab and Current Locks tab we can see the two deadlocked critical sections. Querying the entries on any tab shows that the critical sections do not have any callstacks associcated with them (the Show Callstack… entry on the context menu is disabled).
- To get an idea where in the application the critical section is located we note the address of the critical section. Examining the Locks tab

we determine that the two critical sections have these addresses:
0x00291a74
0x00219aa4 - On the Active Objects tab, click the Refresh button. A list of all critical section initialization calls (and other data) is displayed. Search the list for the addresses 0x00291a74 and 0x00219aa4. In this example, each critical section has been explicitly initialised (as can be seen in the images below).
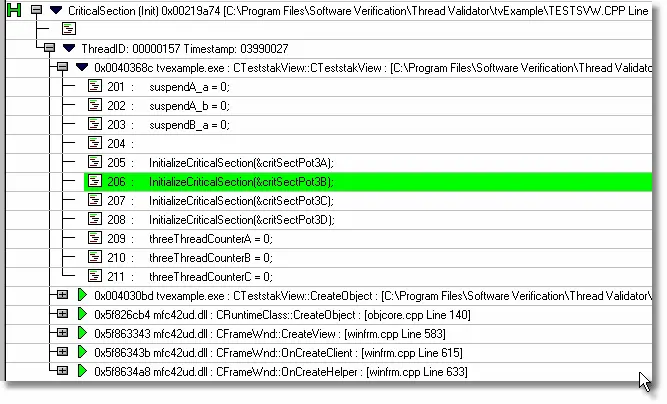
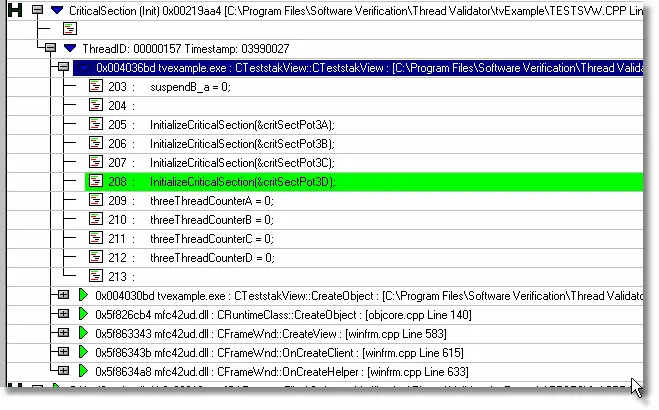
This allows us to identify the critical sections involved in the deadlock as member variables of class CTeststakView having names critSectPot3B and critSectPot3D. Searching the source code for interactions with these critical sections will identify the incorrect threading behavior.
Example 2
- Launch the sample application. Click on the re-launch icon on the toolbar.

- The previously launched application is started.
- From the Test menu, choose the Two thread deadlock submenu, then choose Start Deadlock Thread 1. Notice that the nativeExample user interface shows a counter incrementing.
- From the Test menu, choose the Two thread deadlock submenu, then choose Start Deadlock Thread 2. Notice that the nativeExample user interface shows a second counter incrementing.
- After a while both counters will stop incrementing. This is caused by a coding error in how the two threads interact. The coding error has lead to a thread deadlock, where each thread holds one lock and is attempting to acquire a second lock which is held by the other thread.
- Examining the Locks tab, Per Thread Locks tab and Current Locks tab we can see the two deadlocked critical sections. Querying the entries on any tab shows that the critical sections do not have any callstacks associated with them (the Show Callstack… entry on the context menu is disabled).
- To get an idea where in the application the critical section is located we note the address of the critical section. Examining the Locks tab

we determine that the two critical sections have these addresses:
0x002915fc
0x002195d8 - On the Active Objects tab, click the Refresh button. A list of all critical section initialization calls (and other data) is displayed. Search the list for the addresses 0x002915fc and 0x002195d8. In this example, each critical section will be found to have been initialised by an implicit call to its owning CCriticalSection constructor when the parent object (CTeststakView) was created in its constructor (CTeststakView::CTeststakView).
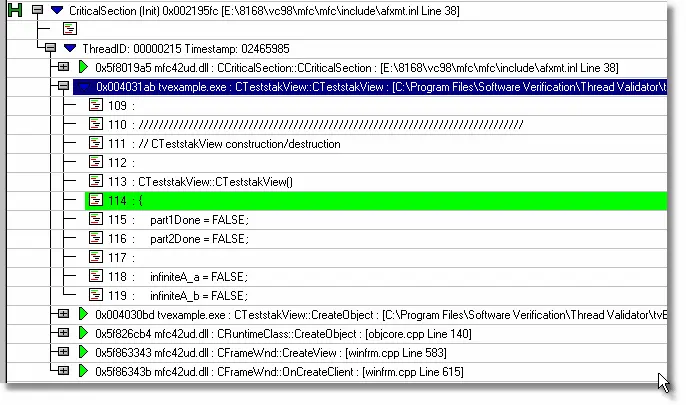
- This implies that although the exact member variable name for the CCriticalSection is not known, the parent object class is known. In this case, the parent object class is CTeststakView. Inspecting this class’s source code will reveal potential CCriticalSection object candidates for causing the deadlock.
- An alternative way of searching for these addresses is to use the Query Address on the Query menu or Query toolbar.

- Clicking the Query Address icon on the Query toolbar displays the Query Address dialog.
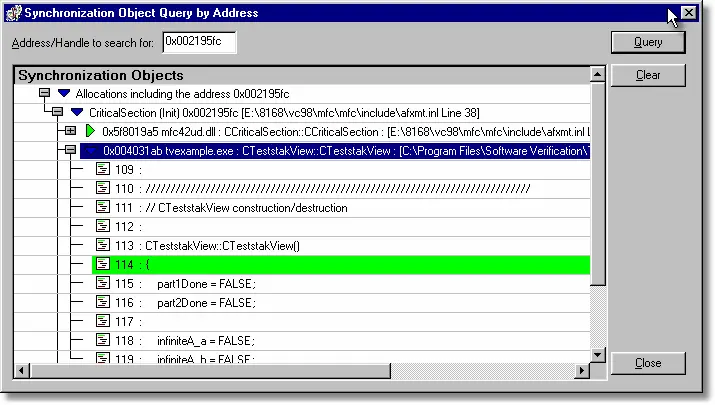
- Type the address of the critical section into the Address/Handle field and click Query. Any calls relating to this critical section are displayed in the list. The dialog is resizable allowing you to choose the most appropriate size. The image shown identifies the same location in CTeststakView::CTeststakView as a potential starting place for a search in the source code.