How to create minidumps using Visual Studio, WinDbg and Exception Tracer
Minidumps can be really useful for creating a self-contained record of a crash for analysis later, either by your own software team, by a consultant, or by a software tool vendor.
In this article I’m going to show you how to create minidumps using Visual Studio, WinDbg and Exception Tracer.
Exception Tracer will allow great control over the minidump contents and automatic creation of minidumps.
Visual Studio
Attach the Visual Studio to the application that you know will crash, then cause the operation that will cause the crash.
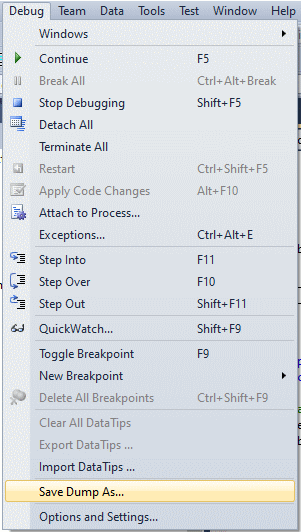
When the application has crashed a new option will appear on the Debug menu. Save Dump As….

The Windows save file dialog will be displayed. Choose a directory and filename to save the minidump.
WinDbg
Attach the WinDbg to the application that you know will crash, then cause the operation that will cause the crash.
When the application crashes type .dump /o /m path-to-minidump.dmp
The /o option ensures that the minidump gets written, overwriting any previous minidump with the same name.
You can use /ma to get more detail.
Example .dump /o /ma e:\minidumps\floating-point-crash-2023-09-12.dmp
Exception Tracer
The default settings of Exception Tracer will not create a minidump. Our first action is to configure Exception Tracer to create a minidump when an exception is thrown.
Open the Exception Tracer settings dialog.
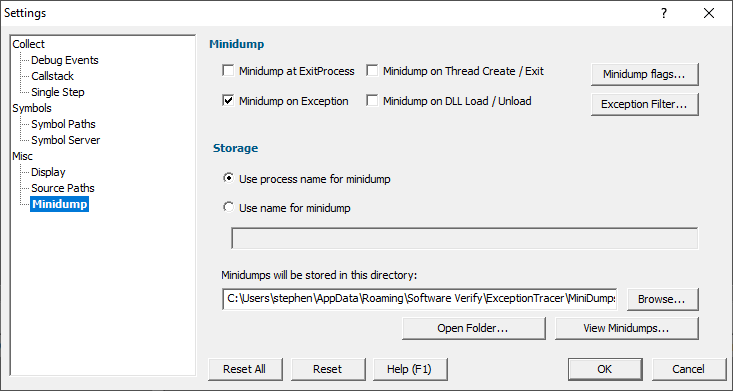
From the Settings menu choose Edit Settings…, then go to the Minidump settings.

Select the Minidump on Exception check box, then Click OK.
Attach the Exception Tracer to the application that you know will crash. From the Debug menu choose Attach to process…, then select your process.
If the application you want to monitor isn’t running yet you can tell Exception Tracer to wait for it to start then attach to it. From the Debug menu choose Wait for process to start…, then specify the application path and click Wait For Process.
Once Exception Tracer is attached to your process, cause the operation that will cause the crash.
When the exception is detected a minidump will be written to the directory specified on the minidump settings.
The default location is C:\Users\<username>\AppData\Roaming\Software Verify\ExceptionTracer\MiniDumps
Custom Minidumps
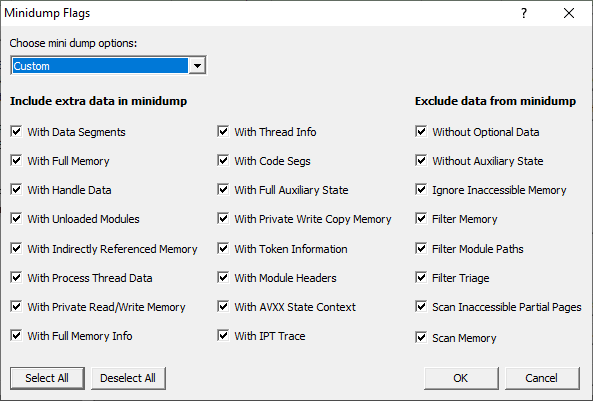
If you want more control over the content of the minidump open the settings dialog and go to the Minidump settings, then click Minidump flags.

Change the minidump options to Custom then select the options that you want. Click OK.
All minidumps created after this change will be saved according to the options chosen.
Creating minidumps from the command line
Exception Tracer can be used to create minidumps from the command line. The minidumps will be saved in the minidump location specified in the settings – these values can be overridden on the command line – see Exception Tracer documentation for details.
For a process that is running
Monitor a process identified by it’s process id
exceptionTracer.exe /miniDumpResetExceptionFilters /miniDumpNameUseProcessName /miniDumpOnException:On /flagMiniDumpNormal /quitWhenProgramFinish /process 2004
Monitor a process identified by it’s application name
exceptionTracer.exe /miniDumpResetExceptionFilters /miniDumpNameUseProcessName /miniDumpOnException:On /flagMiniDumpNormal /quitWhenProgramFinish /processName nativeExample.exe
For an application that will be launched in the future
Monitor the application E:\om\c\bugValidator\examples\nativeExample\ReleaseDynamic10_0\nativeExample.exe
exceptionTracer.exe /miniDumpResetExceptionFilters /miniDumpNameUseProcessName /miniDumpOnException:On /flagMiniDumpNormal /quitWhenProgramFinish /waitForProcess E:\om\c\bugValidator\examples\nativeExample\ReleaseDynamic10_0\nativeExample.exe
Conclusion
You’ve learned how to create minidump using Visual Studio, Windbg and Exception Tracer, and how to create custom minidump using Exception Tracer.