Memory Fragmentation, your worst nightmare
We first know when someone has a memory fragmentation problem when we receive an email that goes something like this:
Hi, we’ve been using Memory Validator for a year or two now. It’s really helped a ton. But now we’re stuck. We can see in Task Manager that our program is using more and more memory (between 32MB and 128MB every 10 minutes) but when I exit the program Memory Validator is reporting no leaks. How can that be? Is there a problem with MV?.
At this point, we ask a few questions and make sure it’s not just a problem with holding onto data until the last minute before freeing it which is causing these reports. Once we’ve ruled that out, we mention the dreaded F word. Fragmentation.
Over the last 11 years, we’ve written many emails to people explaining memory fragmentation and what you can do to mitigate it. I thought we should put this information out there for you all to benefit from. As usual, if you have anything to add, any extra techniques or insights, or constructive criticism, please add a comment or email support.
But I’m working with Linux, or an embedded system
The code examples and the test application (see below) are written for Microsoft Windows.
But, the general principles and the mitigation techniques apply to your software regardless of Operating System. As such, please keep reading. If you’re using Linux, the test application to generate memory fragmentation should run under Wine.
Test application
Because memory fragmentation takes various forms ranging from very subtle to downright blatant in-your-face fail I’ve created a test application you can use to generate on-demand memory fragmentation. You can then play with this application and the suggested tools and techniques to understand fragmentation analysis. And you can analyse the code for the test application to see just how easy it is to create memory fragmentation by using careless allocation strategies.
Learn more about the mvFragmentation memory fragmentation test application.
What is memory fragmentation?
Memory fragmentation is when the sum of the available space in a memory heap is large enough to satisfy a memory allocation request but the size of any individual fragment (or contiguous fragments) is too small to satisfy that memory allocation request. This probably sounds confusing, so I will illustrate how this situation can arise.
To simplify the explanation let us consider a simple computer system that can only allocate 8 chunks of memory, each 1KB in size.
At the program start, the program hasn’t allocated any memory. The memory landscape looks like this:

The application allocates 1KB, 4KB, and 2KB. The memory landscape looks like this:

The program then deallocates 4KB, 1KB. The memory landscape now looks like this:

The program needs to do some other work before repeating its task. It allocates 1KB to store some data during the next task. The memory landscape now looks like this:

Now the first task needs to repeat. The application wants to allocate the 1KB, 4KB workspace that is used last time around (and deallocated at the end of the task). The program allocates 1KB. The memory landscape looks like this:

Now the program wants to allocate 4KB. But although there is 4KB of free space, it is not contiguous. The memory is fragmented.
This is a simplified example. Because I’ve used power-of-two memory allocation sizes this example probably doesn’t exist in real life because many memory allocators use power-of-two sizing to place different allocations in different memory bins. But in terms of demonstrating what causes memory fragmentation, this example demonstrates it perfectly.
What causes fragmentation?
The previous section provided an overview of what memory fragmentation is. Now we investigate some of the causes of memory fragmentation.
Memory alignment
Many memory allocators return memory blocks aligned on specific memory boundaries. For example, aligned with the width of the computer architecture pointer size. For example on a 32-bit chip, the alignment would be 4 bytes; on a 64-bit chip, the alignment would be 8 bytes.
Some allocators allow the allocation requestor to specify the alignment of the allocation being made.
Whatever the reason for the alignment it stands to reason that to satisfy that alignment sometimes there will be unused (or wasted) space immediately prior to the base address of the memory allocation. This wasted space will be after an earlier memory allocation. The space will often be too small for the memory allocator to use to satisfy a memory request.

Heap workspace
For the memory heap to manage itself, the heap must also use memory. For some heaps, the heap uses memory in a separate space from the heap itself. An example of this is the release mode Microsoft C Runtime heap. In other heaps, the heap uses the heap memory to manage itself. An example of this is the debug mode Microsoft Runtime heap. When heap management is done in the heap each allocation adds an overhead for the amount of memory required to satisfy the allocation and to manage the allocation. This overhead increases the size of the allocation and may result in the total size required not matching the allocator’s perfect allocation size, resulting in wasted space.
Heap guard space
Related to heap workspace is heap guard space. This is typically found in debug mode heaps. The guard space is a block of a few bytes before the block and after the block. The guard space is filled with a known value that can be checked at any time to see if it has been modified. This is typically used to detect buffer overruns. The guard space increases the size of the allocation required and may result in the total size required not matching the allocator’s perfect allocation size, resulting in wasted space.
Memory allocator strategies
Each memory allocator has its own strategy for deciding how to allocate memory and provide it to the software calling the allocator. Each allocator strategy will be optimal for some types of usage and less useful or even dangerous in other circumstances. A common strategy is to allocate memory in bins, each bin being of a particular size and each size being twice that of the previous bin.
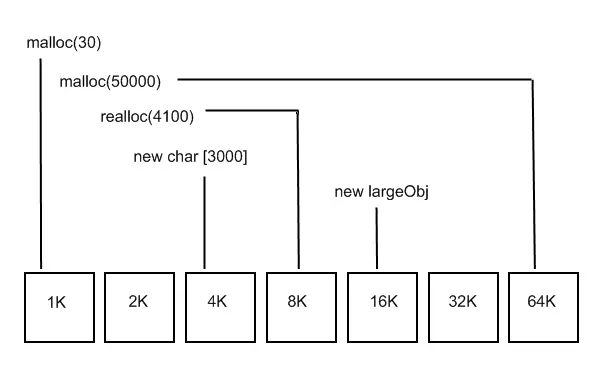
Allocations that fit into a particular bin but which cannot be served by a smaller bin are served by that bin. Bins may be created ahead of time or on a just-in-time basis. If a bin does not exist to satisfy a strategy a new bin will be created. This new bin will be twice the size of the previous bin. Repeat until you get to the bin size you need. This has been shown to be quite a useful strategy. The problem is that this strategy can allocate from bins that are much larger than is required to satisfy an allocation, thus leaving large chunks of memory unused.
Heap allocation usage pattern
Even though you may be using an allocator with a great pedigree and superb performance, at the end of the day the allocator can only do so much when presented with a particular sequence of allocations, reallocations and deallocations by an application. The behaviour of your software and the memory allocation characteristics it exhibits can contribute greatly to the lack of memory fragmentation your application experiences or it can cause the very memory fragmentation problems that are causing you to lose your hair.
As such although most people don’t pay much attention to memory fragmentation because you often do not need to, you need to be aware of what memory fragmentation is, what causes it and how to mitigate memory fragmentation on the (hopefully) few occasions you encounter it.
Memory leaks
Although at the start of this article I said we try to rule out memory leaks as a possible cause you cannot discount them. The cause of the fragmentation could be something as simple as failing to deallocate a small allocation that if deallocated would allow a much larger allocation to be allocated at the same address each time through a computation loop.
An example of this would be a process that each time through its loop (say serving a web page) allocates 1MB to do some work, then 1 byte, then deallocates the 1MB but does not deallocate the 1 byte. Each 1-byte allocation will be locking up a region of memory larger than 1 byte (the bin size from which that 1 byte was allocated). Over time this will eventually turn into a significant memory leak, but before you get to that point there will be a lot of memory fragmentation caused by the wasted memory associated with each 1-byte leak.
Because of this, you must always consider memory leaks before you start thinking about changing your memory allocator or using private/custom heaps. Fixing any memory leak is:
- A smart thing to do.
- A lot cheaper than changing your code to accommodate alternate memory allocation strategies (see later for details).
Implicit memory fragmentation caused by VirtualAlloc
The Win32 function VirtualAlloc() can be used to allocate new blocks of committed memory. When this happens a new block that is large enough to satisfy the memory requirement is allocated. These blocks are allocated in a multiple of the minimum allocation size. The minimum allocation size is found by calling GetSystemInfo() and examining the returned dwAllocationGranularity value. This is typically 64KB.
For most calls to VirtualAlloc() that allocate new chunks of memory, the requested size will be less than the allocated size, resulting in the allocated block and a smaller block that comes after the allocated block. The smaller block’s creation is implicit. If the caller of VirtualAlloc() doesn’t know about this, they will be accidentally creating wasted regions in the memory space because although the memory is usable, there is no way to find the wasted regions address unless you calculate it at the time of the original block allocation. This is best explained with an example:
If you commit a 24KB block of memory with VirtualAlloc():
ptr = VirtualAlloc(NULL, 24 * 1024, MEM_COMMIT, PAGE_READWRITE);
two blocks result:
| 1 | 24KB | Committed | PAGE_READWRITE |
| 2 | 40KB | Free | PAGE_NO_ACCESS |
The first block is pointed to by the pointer returned from VirtualAlloc().
The second block isn’t pointed to by anything. You can calculate where it is if you know about the allocation and the size of the allocation.
The odd wasted block is of not much concern (there is one after every DLL), but wasted blocks that result from treating VirtuaAlloc() like a regular heap will cause memory fragmentation. The best solution is to use a regular heap to provide these allocations, or to create a custom heap to manage the allocations from a VirtualAlloc() backed heap.
We’ve written an in-depth exploration of how VirtualAlloc() can cause wasted memory, plus example mitigation techniques.
Wasted blocks can be identified by VM Validator and VMMap (they are called “unknown” in VMMap).
Memory allocation lifetime
Memory allocation lifetime also plays a part in memory fragmentation. Objects with short lifetimes only occupy space in the heap for a short period of time. As such their effect on fragmentation is minimal. But objects that live for a long period (or forever in the case of leaked memory), prevent the larger space of free memory around them from forming a contiguous free memory region that could satisfy a memory request.
Solutions to this problem are to where possible allocate all long-lived objects in their own heap so that they do not affect the fragmentation of other heaps. If you can’t do this, try to allocate the long-lived objects before any other objects so that they (hopefully) get allocated at one end of the heap or the other (implementation dependent).
Is fragmentation affected by the amount of memory in my computer?
The amount of memory in your computer will not affect whether you suffer memory fragmentation. Memory fragmentation is caused by a combination of the allocation strategy used by the allocator you are using, the sizes and alignments of the internal structures, combined with the memory allocation behaviour of your software application.
That said the more memory you have the longer it will be before you feel the effects of memory fragmentation. That isn’t necessarily a good thing. The sooner you know about it the sooner you can fix it.
Conversely, if you don’t have a lot of memory you may not experience memory fragmentation because your program doesn’t have enough workspace to get into a situation where memory fragmentation is an issue. Given the memory that most modern PCs have these days, I doubt this situation will be facing you.
Does fragmentation affect all computer programs?
Memory fragmentation affects all computer programs that use a dynamic memory allocator that does not use garbage collection (or similar mechanisms) to remove memory fragmentation by compacting the memory heap.
It is important to note that some garbage-collected allocators have a Large Object Heap which is used to handle large memory allocations. Examples of this are the Microsoft .Net Runtime and Java. These Large Object Heaps are not compacted. As a result, even these garbage collected heaps can suffer memory fragmentation, but only for large objects. What constitutes “large” is implementation dependent. For .Net, “large” means 85,000 bytes.
Systems that do not use dynamic memory allocators do not suffer from memory fragmentation. Examples of these are many small embedded systems. Although an embedded system in the late 1980s was an 8-bit 6801 with 64KB of RAM programmed in assembler, whereas now it’s a 32-bit ARM with 256MB RAM and a C compiler. So today, it’s quite possible your embedded system is at risk from memory fragmentation whereas the devices I worked on 25 years ago were not at risk.
When is fragmentation more likely to be a problem?
Fragmentation is more likely to be a problem when your application makes a series of allocations and deallocations such that each time an allocation is made it cannot re-use space that was left by a previous deallocation of a similar (or larger) size block.
Or put another way if you have a large range of widely differing memory sizes in your program’s memory allocation behaviour you probably stand a higher chance of suffering from memory fragmentation than if all your memory allocations are of similar sizes.
How can I detect if my program is suffering from fragmentation?
There are telltale signs that your program may be suffering from fragmentation:
- One sign of memory fragmentation is that your program may start to run a lot slower. This is because the allocator has to spend more time searching for a suitable place to put each memory allocation. You’ll notice this for applications that have a very subtle form of memory fragmentation which only wastes small amounts of memory for each fragment.
- Another sign of memory fragmentation is that some memory allocations fail but most memory allocations succeed. Yet when you examine the amount of memory used by your program there always seems to be enough memory to satisfy even the memory allocation calls that failed. The type of fragmentation that wastes large amounts of memory and prevent large allocations from happening – these programs tend to run at full speed and then just fail to allocate memory. Much less subtle, but easier to identify the problem.
- If you are using a custom heap and have access to some heap diagnostics then you can perform the following calculation to determine if that heap is fragmented. Find the largest free block size in the heap (not a block that is in use). Find the total free space in the heap. If the largest free block size is small compared to the total free size then you probably have a fragmentation problem. What defines “small”? Well, that is for you to decide based on your understanding of the application you are working on. No absolute values. Sorry.
There are several methods you can use to detect memory fragmentation. These all involve the use of free tools and/or commercial tools. Firstly we need to establish that the software does not suffer from any memory leaks and also does not suffer from any resource (handle) leaks. You can do this with your favourite memory leak tool, for example, Memory Validator.
Once you know there are no leaks occurring when you run the software we can turn our attention to the memory allocation behaviour of the software. We can inspect this using various tools. These are listed in the order they were created.
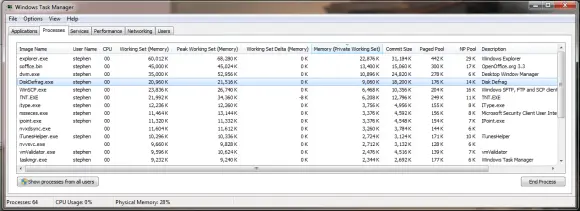
Task Manager
Task Manager can be used for identifying trends in memory usage. Both the graphical display and the various memory counters can help you.
There are various memory-related counters:
-
-
- Memory Working Set
- Memory Peak Working Set
- Memory Working Set Delta
- Memory Private Working Set
- Memory Commit size
- Memory Paged Pool
- Memory Non-paged Pool
-
The counters you are interested in are Private Working Set and Memory Commit Size.
The other counters may be increasing, or decreasing, but they are irrelevant. We are concerned about ever-increasing application memory use. As such we want to know the private amount of memory in use – the memory that is not shared with other applications. The commit size also shows you the amount of memory in use instead of being reserved for possible use. Another counter that also reflects the total memory size of the process is Virtual Memory Size (VM Size).
If these values continue to increase but your memory leak tool shows that you have no memory leaks then your application is almost certainly suffering from memory fragmentation.
VM Validator
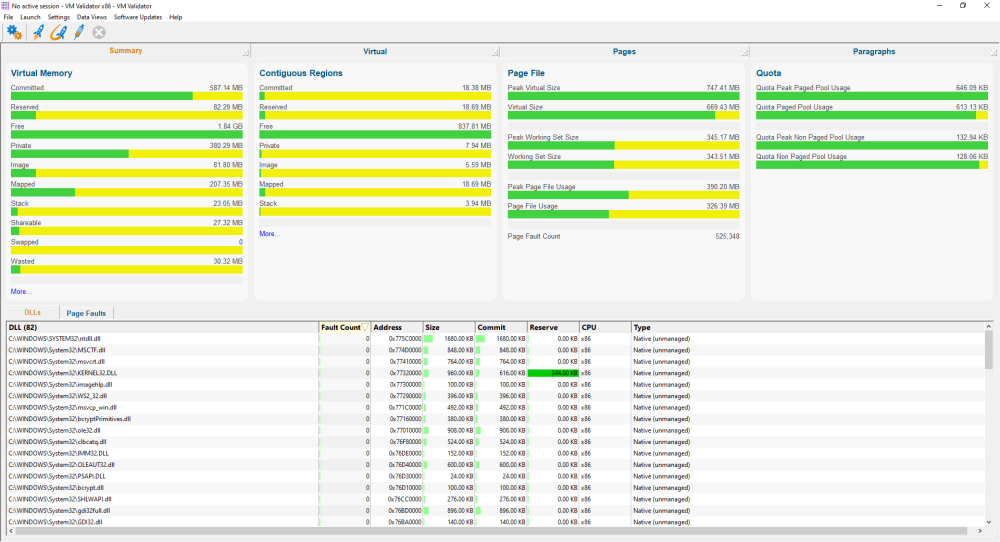
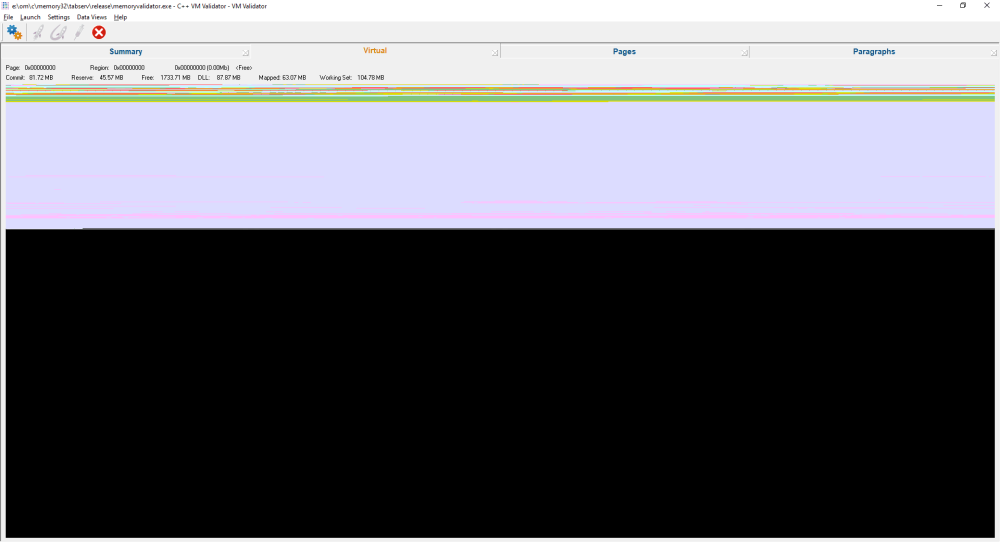
VM Validator is a free software tool for visualising virtual memory. We wrote this tool over 20 years ago so that it was easy to visualize memory fragmentation problems that would cause memory allocation failures when allocating large blocks of memory. Using the virtual view you can watch your application’s memory usage. This is particularly useful when you watch what happens when you load a large image (satellite photo), do some work, unload it, do some work, and then load another image. If you are suffering from fragmentation, you can see the image doesn’t reload in the same place each time. VM Validator provides a view of the page fault behaviour of your software and the following three views which will be useful for investigating memory fragmentation.
- Summary view. Examine the Wasted statistic in the Virtual Memory tile. Click on the Wasted bar to view the statistic on the Pages view.
- Virtual view. A graphical view of virtual memory. Using this view you can watch your application’s memory usage. This is particularly useful when you watch what happens when you load a large image (satellite photo), do some work, unload it, do some work, and then load another image. If you are suffering from fragmentation, you can see the image doesn’t reload in the same place each time.
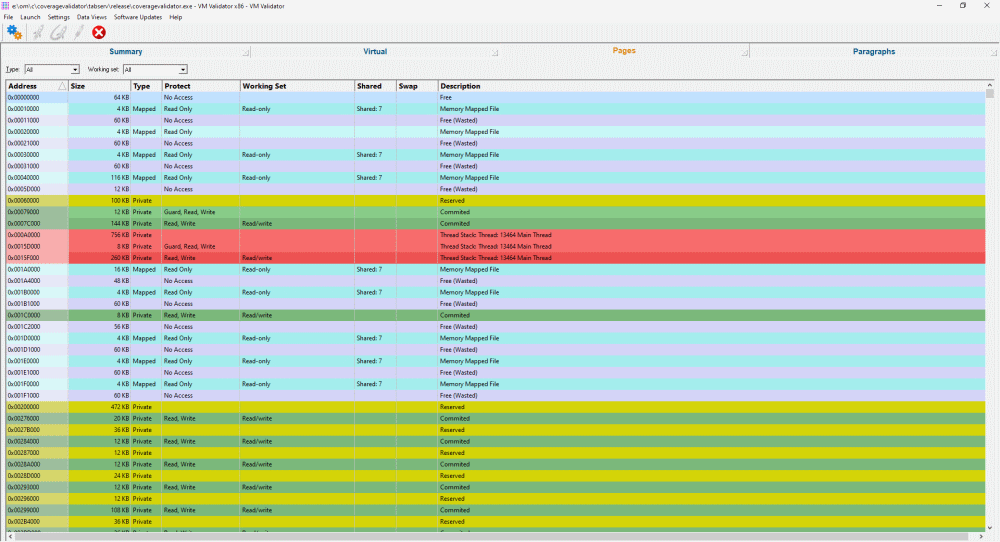
- Pages view. A breakdown of memory pages by memory region.
Change the Type filter to Private, then scan all columns looking at the Description column, looking for “Free (Wasted)”. Ignore all the entries immediately after a DLL. Anything that remains may be wasted memory causing memory fragmentation.
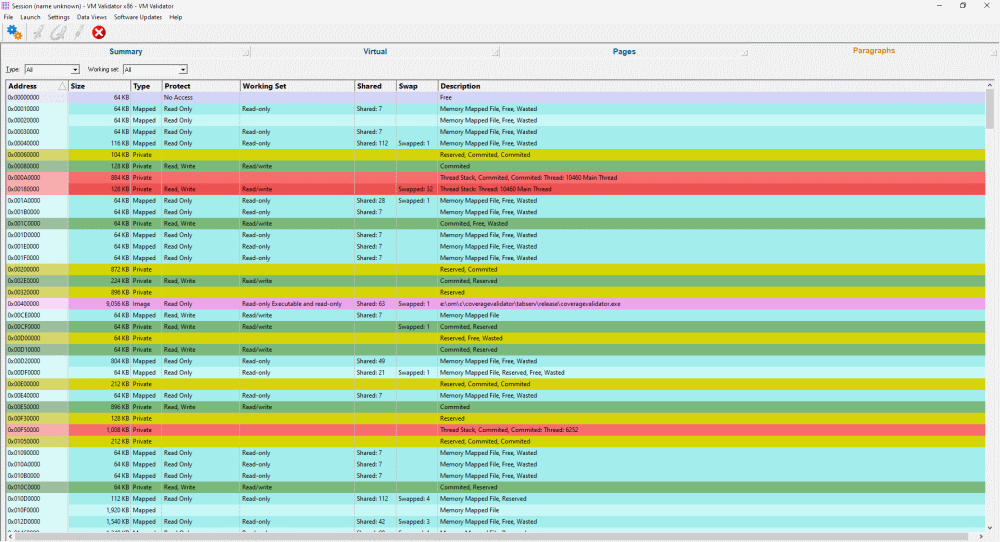
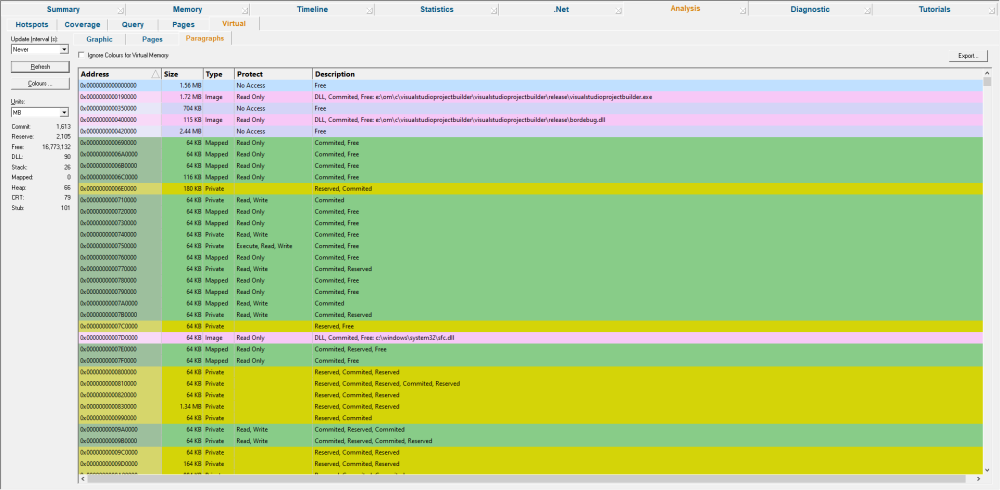
- Paragraphs view. A breakdown of memory paragraphs by memory region. Memory Paragraphs are the minimum size (64KB) allocated by VirtualAlloc().
Change the Type filter to Private, then scan all columns looking at the Description column, looking for “Free (Wasted)”. Ignore all the entries immediately after a DLL. Anything that remains may be wasted memory causing memory fragmentation.
Memory Validator
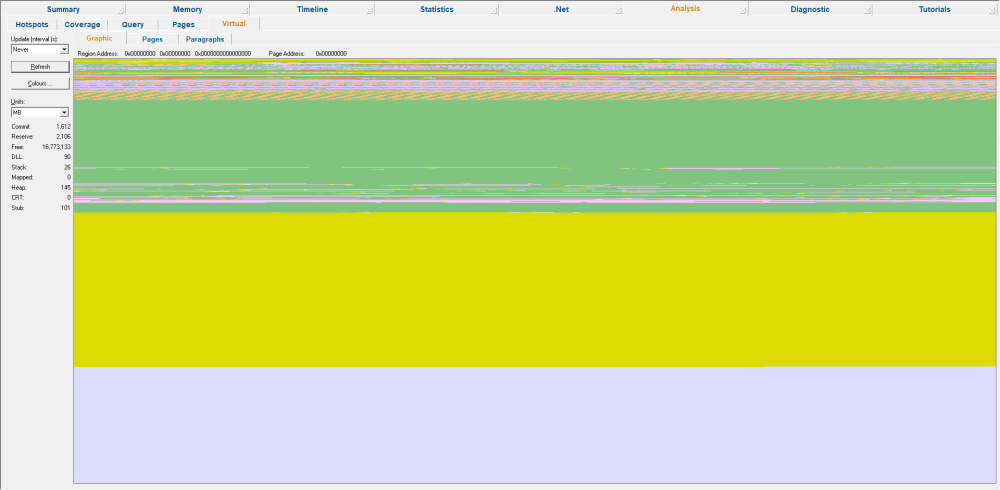
Memory Validator is our memory leak detection tool. Memory Validator also has a similar view to the VM Validator tool. This view is the virtual view and shows:
- Virtual view. A graphical view of virtual memory. Using this view you can watch your application’s memory usage. This is particularly useful when you watch what happens when you load a large image (satellite photo), do some work, unload it, do some work, and then load another image. If you are suffering fragmentation you can see the image doesn’t reload in the same place each time.
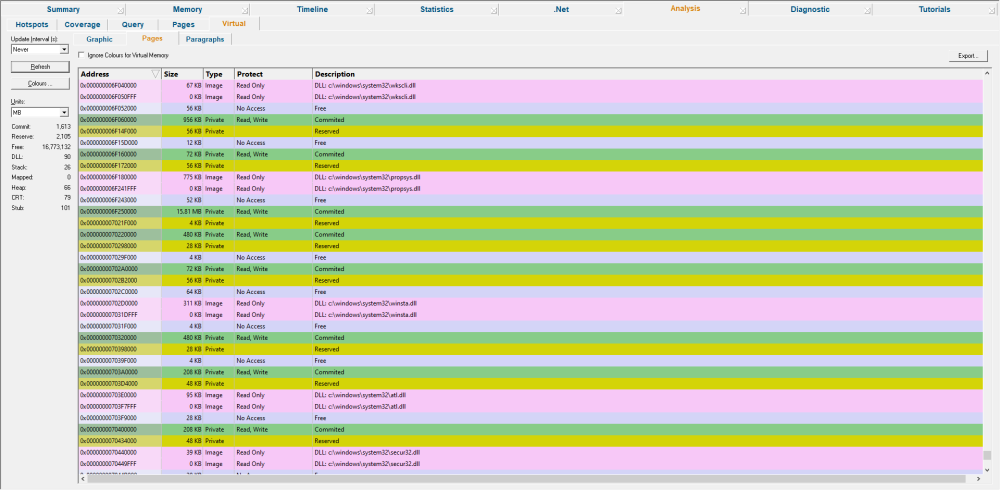
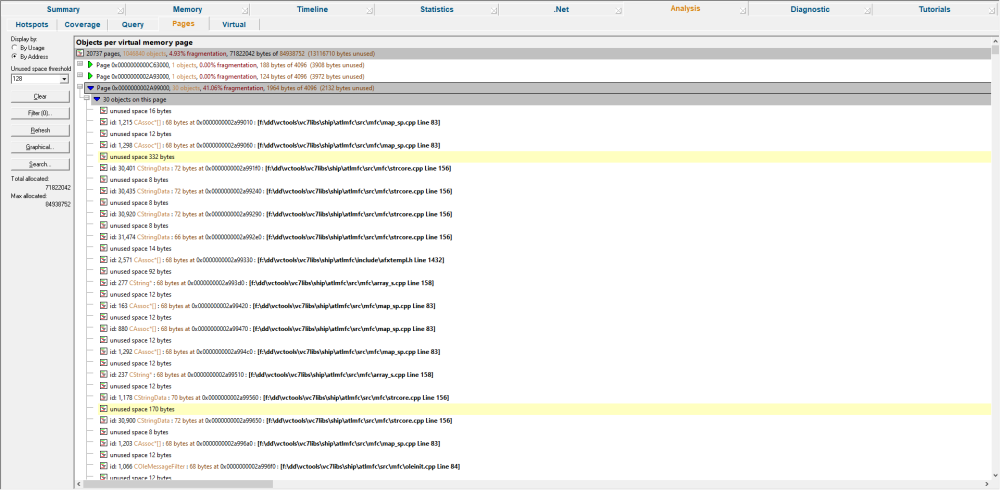
- Pages view. A breakdown of memory pages by memory region.
- Paragraphs view. A breakdown of memory paragraphs by memory region. Memory Paragraphs are the minimum size (64KB) allocated by VirtualAlloc().
- Sandbar view. A visualization of the memory collected by Memory Validator so that you can see the memory gaps (or sandbars) between each currently active object – this is the Pages view (not the Pages subtab on the Virtual view).
Process Explorer
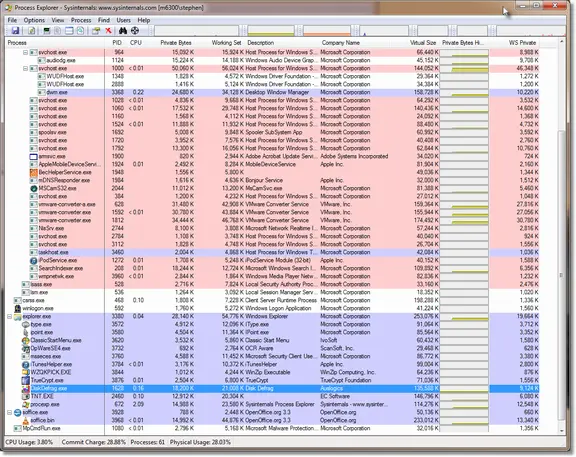
Process Explorer from SysInternals can also be used to monitor memory. If you go to the View menu then choose Select Columns… then go to the Process Memory tab you can select which values you want to view. Selecting Virtual Size allows you to see the total size of your application’s virtual memory. You can save these values for later use by going to the View menu and then choosing Save Column Sets….
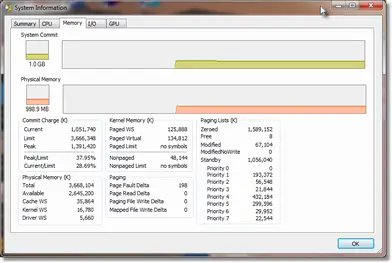
Double-clicking a graph will display the resource monitor so that you can inspect the data more clearly.
VMMap
VMMap is another SysInternals tool that shows you the virtual memory map of your application. This is similar to VM Validator but very different in appearance. You can use it in a similar way to how we described above.
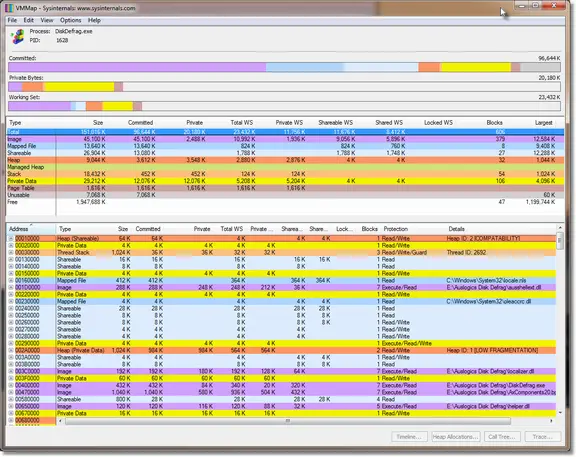
VMMap also has a “fragmentation view” which you can access from the View menu. This is similar to the VM Validator Virtual view.
How do I prevent fragmentation?
It’s almost impossible to prevent memory fragmentation before seeing it because it is a function of your application’s behaviour. However, once you’ve ruled out memory and resource leaks and established that memory fragmentation is the problem then there are various tactics and strategies you can use to mitigate the memory fragmentation.
Premature optimisation
You’re no doubt familiar with the phrase that the worst type of performance optimisation is premature optimisation. This is also true of memory fragmentation. Do not try to guess ahead of time which parts of your program will cause fragmentation and which parts won’t. You almost certainly won’t get it right. This will mean wasted effort on custom heaps for areas that don’t need it. And most likely a more complex implementation than required. Much better to write your software, then observe its behaviour and address the behaviour you find, if you need to.
Different approaches
There are a variety of different approaches that can be taken to mitigate memory fragmentation. You can use each approach on its own or in conjunction with other approaches listed here. None of these approaches is mutually exclusive.
Use the Windows Low Fragmentation Heap
The Windows Low Fragmentation Heap (LFH) was introduced with Windows XP. It was also backported to Windows 2000 SP4 although I doubt many of you reading this will still be working on Windows 2000, although many of you are still working on Windows XP (after all, your customers still are!).
The LFH can be enabled or disabled using HeapSetInformation.
Note that you cannot enable the LFH for heaps that have the HEAP_NO_SERIALIZE flag set.
#define HEAP_LFH 2

HINSTANCE hKernel;

hKernel = GetModuleHandle(_T("kernel32.dll")); // kernel32 is always loaded, so can just lookup
if (hKernel != NULL)
{
    HeapSetInformationProc hsip;

    hsip = (HeapSetInformationProc)GetProceAddress(hKernel, "HeapSetInformation");
    if (hsip != NULL)
    {
        ULONG enable = HEAP_LFH;
        BOOL b;

        b = (*hisp)(hHeap, HeapCompatibilityInformation,
                    &enable, sizeof(enable));

        // add error checking here

        ...
    }
}
Replacement heap manager
Probably the easiest and simplest approach to take is to try swapping out the memory manager for a different memory manager. There are commercial and open-source heap managers available. Commercial:
- Cherrystone’s Extensible Scalable Allocator (ESA). I think Cherrystone are out of business. The link we had no longer works.
- MicroQuill’s SmartHeap. The link was broken (under maintenance) the last time we checked. http://www.microquill.com/smartheap/index.html
Free:
- Hoard memory allocator. GPL and commercial licences are available.
- Google TC Malloc: Thread Caching Malloc
- Doug Lea’s allocator.
- jemalloc.
I’m not saying that you should try one of these allocators. I have no idea how simple or complex it is to replace your allocator with another. But if it is simple to replace, then trying another allocator to see if that allocator handles your application’s memory allocation behaviour such that your memory fragmentation problems are solved. That may be a good, effective use of your time.
Custom heap manager
You could try writing your own heap manager to reduce memory fragmentation. But I don’t recommend it. This is a non-trivial task (even if it seems trivial at first glance) if you want to have good CPU performance, good memory performance, and good robustness and good allocation strategy. There are companies whose entire business model provides high-performance heap managers. If a business can be built on this, you can bet it’s not a trivial job.
That said, if you can find a special edge case (as we have, see Linear Heap below), then writing your own custom heap manager can be very helpful.
Allocate objects in specific heaps
Rather than just use malloc, new etc to allocate in the C runtime heap you could choose to do all allocations for specific objects in a specific heap created by using HeapCreate(); This is useful because it forces all allocations of a specific size and type into one heap. Thus the allocation behaviour that was causing fragmentation in one heap is now split among many heaps and may not cause fragmentation when split like that.
    char *ptr;

    ptr = HeapAlloc(hStringHeap, 0, len);
    if (ptr != NULL)
    {
        strcpy(ptr, data);

        ...
    }
Then when you are at a suitable point where you can destroy the heap you can do that, and then re-create the heap effectively setting fragmentation for that heap to zero.
Override operator new / operator delete
This is a variation of the previous topic. You override operator new and operator delete to place different object types in different heaps. There are many ways you can set this up. This is a simple example where you set the heap for the class using a static function. Derive all other classes for this heap from this base class.
    class myObject
    {
    public:
        myObject();

        virtual ~myObject();

        void *operator new(size_t nSize);

        void operator delete(void *ptr);

        static void setHeap(HANDLE h);

        private:
        static HANDLE hHeap;
    };

    HANDLE myObject::hHeap = 0;

    myObject::myObject()
    {
    }

    myObject::~myObject()
    {
    }

    void *myObject::operator new (size_t size)
    {
        return HeapAlloc(hHeap, 0, size);
    }

    void myObject::operator delete (void *ptr)
    {
        if (ptr != NULL)
        {
            HeapFree(hHeap, 0, ptr);
        }
    }

    void myObject::setHeap(HANDLE h)
    {
        hHeap = h;
    }
Reduce the number of allocations and deallocations
If you can reduce the number of memory allocations and memory deallocations you are reducing the chance for fragmentation to occur. As such anything you can do to reduce how often you allocate or deallocate memory will usually help. From this stems the concept of memory pools and reuse.
Memory reuse
If you have commonly used chunks of memory of the same size that are allocated and deallocated frequently then you may be better off reusing the allocated memory rather than deallocating it and then reallocating it. This places less stress on the memory allocator, is faster and reduces fragmentation.
If you are reusing a large number of memory allocations you’ll probably need to have a manager class for each group of allocations so that you can ask for a new object to work with. We do this as part of our communications buffer handling in our software tools.
Object reuse
Another variation on reducing the number of memory allocations and deallocations is to reuse objects. This reduces fragmentation. There are a few ways to reuse objects. You can simply reuse the object you have. To do this you may reinitialise it by copying a different object to it, or you may call a method to reset the object. We’ve seen cases of people calling the object destructor to destroy the object contents – this works because they don’t call delete, thus the memory is not deallocated.
objectPtr->~dingleBerry();
Probably not the most common practice you’ll see. We prefer to implement a dedicated reset() / flush() method which resets the object. We typically call that from the destructor.
If you are reusing a large number of objects you’ll probably need to have a manager class for each group of objects so that you can ask for a new object to work with. We do this as part of our communications buffer handling in our software tools.
Memory pools
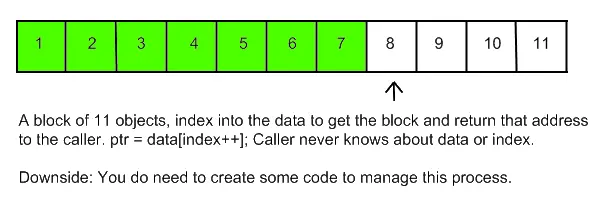
Sometimes it’s better to plan ahead and allocate all the objects ahead of time. These objects then live in a pool. When an object is needed the code asks the pool manager for an object. The object is used. When the object is no longer needed it is given back to the pool manager. The same strategy can be applied to memory chunks of given sizes.
This can be particularly effective if you allocate all the objects or memory blocks in one allocation and then divide that allocation into the appropriate number of memory blocks or objects. This allows no scope for fragmentation within the large allocation.
Destroying custom heaps
If you are using custom heaps to store data of a particular type if you can completely destroy the heap at a particularly opportune moment and then recreate it then you can effectively set the heap fragmentation to zero for that heap. Good opportunities for this are when you close a document or when data queues get empty.
Linear heaps
You can use what we call a linear heap to provide a zero fragmentation heap. A linear heap can however only be used in a restricted set of circumstances.
A linear heap is a memory heap that allows you to dynamically allocate memory with the proviso that you must deallocate memory in the order it was allocated. Memory cannot be reallocated, expanded or compacted in place (no support for realloc() or __expand()). These restrictions mean that the heap can contain many allocations and each allocation sits immediately after the previous allocation. There is never any gap between the end of one allocation and the start of another allocation (except for alignment purposes). Deallocations simply remove the data from the start of the heap. The heap is split into pages. A page is created when the current page is full and cannot hold any new allocations. As memory is deallocated from a heap page the page holds fewer data until eventually, it holds no data. When a heap page is empty it is discarded to either the free list for reuse or it is decommitted back to the operating system for reuse.
This type of heap is very fast to use as it doesn’t need to think about the best fit, find an unused block that’s the right size or any of the other housekeeping tasks that most memory allocators have to do. The heap also doesn’t use any of the power of 2 or other strategies to manage memory. Memory is simply allocated in a linear fashion, marching through the memory space the heap is using. When that space is exhausted more is requested and the same procedure is followed. The heap never suffers from memory fragmentation.
We use linear heaps in all our inter-process communications queues. Memory Validator in particular puts quite a stress on the communications queues due to the fact it can queue up to 1 million items before switching to synchronous communications. One of our customers runs tests that monitor multiple billions of events over several days. Part of what allows that to happen is despite the wide variety of data sizes (many of which are defined by the data in the customer’s application) our monitoring software does not suffer from memory fragmentation in these key high-use components.
So far as we are aware the linear heap is our own invention. We haven’t heard of anyone using them before.
Intern all strings
If you can intern various objects such that for each use of the object a single instance can be used this can prevent fragmentation caused by the creation and destruction of many instances of such objects.
Example: A classic case for interning is the use of strings. Consider that you have an application that needs to process a large number of strings but the application does not know the content of the strings but the application does know that any duplicates can be reduced to a single copy. A good example would be a debugging symbol handler. You may have 100 classes but the full symbol name for each method is className::methodName so className can be interned. What about the method names? These can also be interned so that any references to the method name are only stored once.
There are some useful side effects of this technique:
- Reduced memory use.
- Faster processing due to fewer memory allocations and deallocations.
- Reduced fragmentation due to less heap usage.
- You can easily store these interned objects in their own heap allowing you to deallocate all objects just by destroying the heap, reducing any fragmentation in that heap to zero.
We use a variant of this technique to manage the symbols in our software tools.
VirtualAlloc
If you are using VirtualAlloc() to allocate large blocks of memory (for loading data into or for implementing a custom heap) it may be worth trying the MEM_TOP_DOWN_FLAG to force VirtualAlloc() to allocate blocks at the top of the address space. This means the addresses of any VirtualAlloc’d allocations will not be near any allocations made by the C runtime or HeapAlloc() etc. This could prove to be quite useful in many situations for preventing memory fragmentation.
Caveat. Depending on the behaviour of your program using VirtualAlloc() with the MEM_TOP_DOWN flag may not be a good idea – it could cause things to be much slower. Read this informative blog posting before proceeding. Summary: If using VirtualAlloc() with MEM_TOP_DOWN a little bit that’s OK, but using it to make a lot of allocations in a short amount of time, could be very slow.
Analyse your application’s memory allocation behaviour
To inform your decision for the above-mentioned strategies and tactics you could also examine the number of allocations and objects of different sizes to try to identify any commonality in allocation sizes. You could also try to identify the application hotspots – places where the application performs the most of its allocations and see if you can then optimise these to use object/memory pools or if you can reuse a memory/object allocation rather than deallocating it and then reallocating it later.
We don’t know of any tools that can do this apart from our memory tool Memory Validator.
- The types tab will give you the breakdown of the number of objects of each type allocated.
- The sizes tab will give you the same information for each memory allocation of a particular size (this data includes object sizes).
- The locations tab will give you the same information for each memory allocation at a particular filename and line number.
- The hotspots tab, if you set it to display All Allocations will show you a hierarchical allocation tree showing you the hotspot locations for allocations, reallocations and deallocations. This allows you to identify which functions are allocating the most objects and the call stack for that allocation.
Once you know this information you make much more informed decisions about which objects/allocations should have their own private heap space, which ones should be in memory pools and which ones should be left alone.
Is it possible to guarantee zero fragmentation?
The only way to guarantee zero fragmentation is to either write your software in a language (or style) that does not use dynamic memory allocation or to use an appropriate technique to mitigate any fragmentation you may experience. By far the best technique is to destroy each heap when you get an opportunity to do so. This resets fragmentation for the memory controlled by the heap to zero.
What about .Net – can that suffer from fragmentation?
Yes. The .Net Large Object Heap (LOH) can suffer from fragmentation because the LOH is never compacted after a garbage collection.
Also in the regular .Net heap pinned objects cannot be moved. Objects that cannot be moved prevent the heap from being compacted in the most optimal manner. Depending on how your objects are pinned this could cause quite bad fragmentation of the .Net heap.
If you do need to pin objects you may want to think about moving those objects into the native heap and then using the techniques in this article to ensure they all end up in the same place using an object pool etc. This would move the pinned objects out of the .Net heap and allow .Net heap compaction to proceed as normal.
How can I prevent fragmentation in the Large Object Heap for C#?
With the .Net Large Object Heap (LOH) it really depends on what data you’ve got in the LOH as to what you can do to mitigate the memory fragmentation.
You should definitely consider object reuse and object pooling (as mentioned above).
Arrays of doubles
Arrays of type double with 1000 objects or more are placed on the Large Object Heap. Try to keep all your double arrays smaller than 1000 items.
Don’t create large objects
Objects 85,000 bytes or larger are placed on the Large Object Heap. Arrays can easily exceed 85,000 bytes so you should be careful about creating arrays with more than 10,000 items. Alternative arrangements that split one large array into several smaller arrays that are managed by a parent object that provides an array-style interface would prevent these arrays from entering the Large Object Heap as each individual array would be below the threshold for entering the Large Object Heap.
.Net 4.51 onwards
Starting with .Net 4.51 Preview there is a special option to force the Large Object Heap to compact itself. This is not automatic but controlled by the software engineer via an API call.
GCSettings.LargeObjectHeapCompactionMode = GCLargeObjectHeapCompactionMode.CompactOnce;
GC.Collect(); // This will cause the LOH to be compacted (once).
Conclusion
I hope you now have a better understanding of the cause of memory fragmentation and what you can do to improve any memory fragmentation issues you may be facing. If you can use a linear heap it’s an excellent, high-speed solution. If you can’t then look at drop-in replacement heaps or assigning objects to specific custom heaps, object reuse, memory reuse and pooling.