Monitoring memory use in a JNI DLL called from Java
Java is a garbage-collected language that allows you to extend the language with code written in C and C++.
Given that the extensions are written in C or C++ the normal tools for monitoring Java memory usage will not report the C/C++ memory usage. So how do you monitor the memory usage of these JNI extensions when called from Java? This article is going to explain how to do this task.
Building an example JNI test
The first thing to do is to create an example to work with. The post Creating a JNI example for testing describes how to create a JNI example (both Java code and JNI C/C++ code, with downloadable source and project files). Please download the example code and build the example.
Monitoring JNI Memory
Monitoring memory in JNI extensions is straightforward. Java programs are executed by running a Java Virtual Machine (JVM). These are typically named java.exe, javaw.exe, jre.exe, jrew.exe. We can just launch java.exe with a C/C++ memory leak detection software tool and monitor the results.
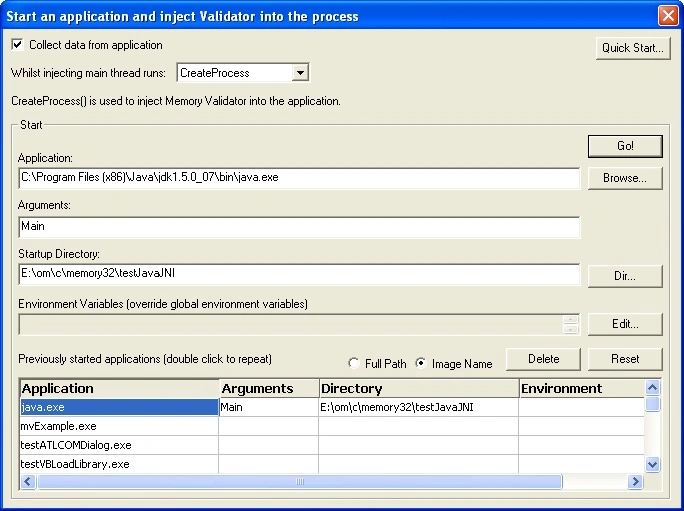
For this example, we are going to monitor java with C++ Memory Validator. The image below shows the launch dialog (note if you are using Memory Validator for the first time you will be using the launch wizard, which is slightly different)
Items to note:
- Application is set to the path to java.exe. C:\Program Files (x86)\Java\jdk1.5.0_07\bin\java.exe
- Arguments is set to the name of the class to execute. Main
- Startup directory is set to the directory containing the class to execute (and the native DLL to monitor). E:\om\c\memory32\testJavaJNI
- If you wish to set the CLASSPATH you can set it in the Environment Variables part of the launch dialog. If you do not set the CLASSPATH here (as in this example) the CLASSPATH will be taken from the inherited environment variables of Memory Validator’s environment. For this example CLASSPATH is set in the global environment variables and thus does not need to be set on the launch dialog.
Initial Results
- Click Go! to start the Java program.
- Java is started, Memory Validator monitors the application and records all memory allocations and deallocations.
- Any memory not deallocated by the end of the program is a leak.
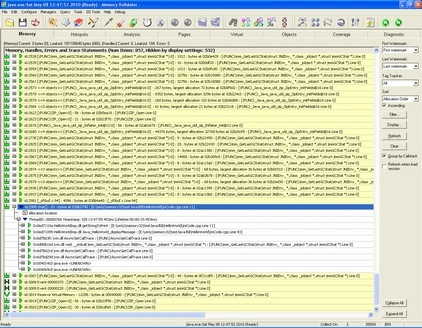
As you can see from the screenshot above, there is a quite a bit of memory left over after a simple run of this example Java program which does very little except load a native extension that prints Hello World! twice and deliberately leaks one 20 byte chunk of memory.
The example image indicates there are 857 items, some of which are handles, the remainder are C/C++ memory allocations. There are 3,493 events. The memory leak we are interested in occurs at event 2,985.
Clearly, this is inefficient. To find memory leaks in your code you are going to have to wade through all the noise of the memory allocations made by Java and the JVM.
There must be a better way!
There is. We’ll focus only on the native DLL that prints the Hello World! messages.
Focus on the JNI DLL
Open the settings dialog and go to the Hooked DLLs section.
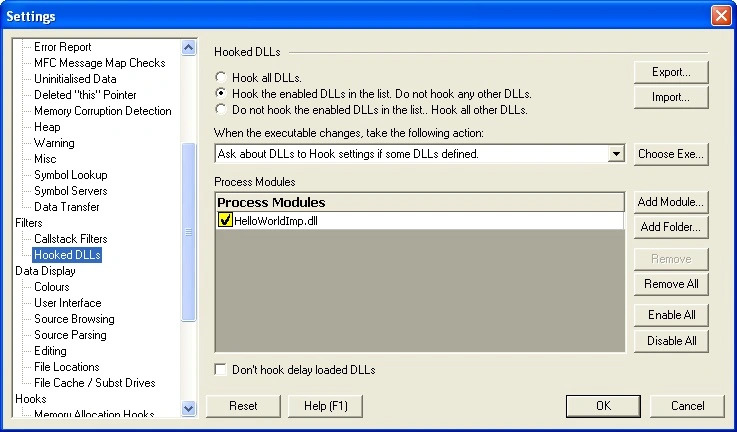
- Select the second radio box to indicate that only the DLLs we list will be monitored.
- Now click Add Module… and select the HelloWorldImp.dll.
- Click OK.
Memory Validator is now configured to monitor only HelloWorldImp.dll for memory and handle allocations.
Relaunch the java application with these new settings.
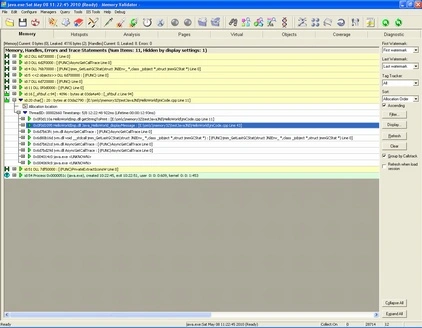
As you can see from the picture above much less data is collected.
A total of 11 events compared to the previous session’s 3493 events. This is much more manageable.
This reduced amount makes it very easy to identify errors in the DLL.
- 8 events are DLL loads (MV always reports DLL loads regardless of settings)
- A one-time, per-thread, buffer allocation inside printf
- A memory leak that is deliberately present in the example JNI code
- The final event is the status information for the application at the end of its run
If you don’t wish to see the DLL loads you can filter them out with a global, session or local filter.
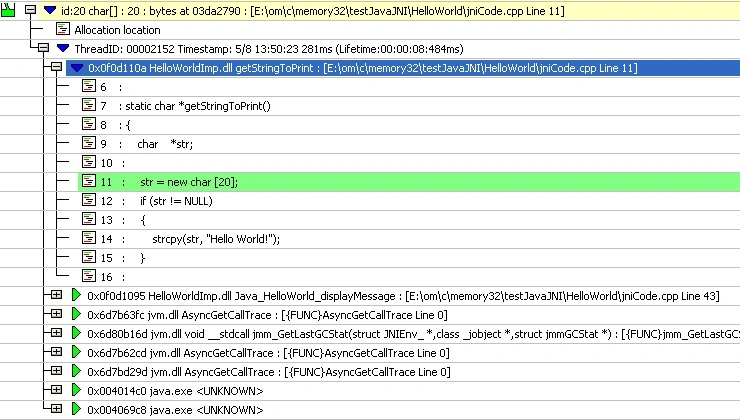
The image above shows the source code of the location of the leaking memory in the JNI extension.
Conclusion
Monitoring memory allocations in JNI Dlls called from Java is a straightforward task.
Things to remember:
- Ensure your JNI DLL is compiled with debugging information and linked with debugging information.
- Ensure your JNI DLL debug information is present (put the PDB file in the same directory as the DLL).
- Ensure your CLASSPATH is set correctly so that when Memory Validator starts your Java application the correct CLASSPATH is used.
- If it’s easier to start your Java program from a batch file (because that’s where you configure your environment variables) that’s OK. Specify your batch file as the application to run.
- Setup a Hooked DLLs filter to identify your JNI DLL (and any other DLLs you wish to monitor)