Slicing and dicing by memory allocator
We’ve just released Memory Validator 9.63.
This release introduces improvements for viewing trending statistics by allocator type.
The Job To Be Done behind these changes is making it easier to view data related to just one allocator type. If you’re interested in GDI handle leaks tracking the growth in numbers is going to be easier if you can view just the allocations of the appropriate handle types, rather than all handle types and all memory types. Similarly, if you’re interested in memory leaks that come from the Win32 HeapAlloc family of allocators it will be much easier just to view those rather than all memory types and all handle types.
These changes apply to the following user interfaces:
- Running Object Totals
- Timeline
- Statistics / Types
- Statistics / Sizes
- Statistics / Locations
We’ve also modified the UX for Statistics / Generations and Statistics / Ages to make them more consistent with layout expectations for the other sub-tabs of Statistics.
The data surfaced by these changes has always been in Memory Validator, but you’d have to examine the data reports in detail to find it. Now you can view this data very easily.
Running Totals
We’ve added four new categories to more easily identify memory and handle groups of interest:
- GDI handles
- USER32 handles
- Internet handles (socket and WinHttp APIs)
- Printer handles (printer spool API)
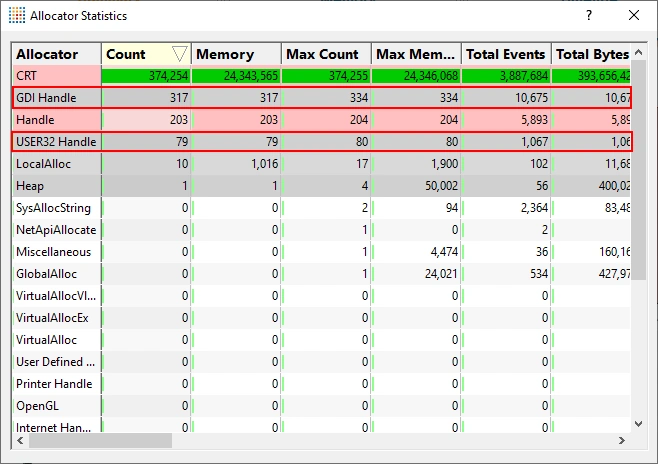
Here you can see GDI handles and USER32 handles in the new report.
Timeline
The timeline has just two new allocators added to it.
We could add all 36 allocator groups to the timeline but that would make the timeline unusable. The best compromise seemed to be to add just the two headline allocator groups of GDI handles and USER32 handles to the timeline. This means that the “All” timeline will display 40 different graphs at the same time, whereas some specialist single-topic timelines will display just 5 graphs at a time.
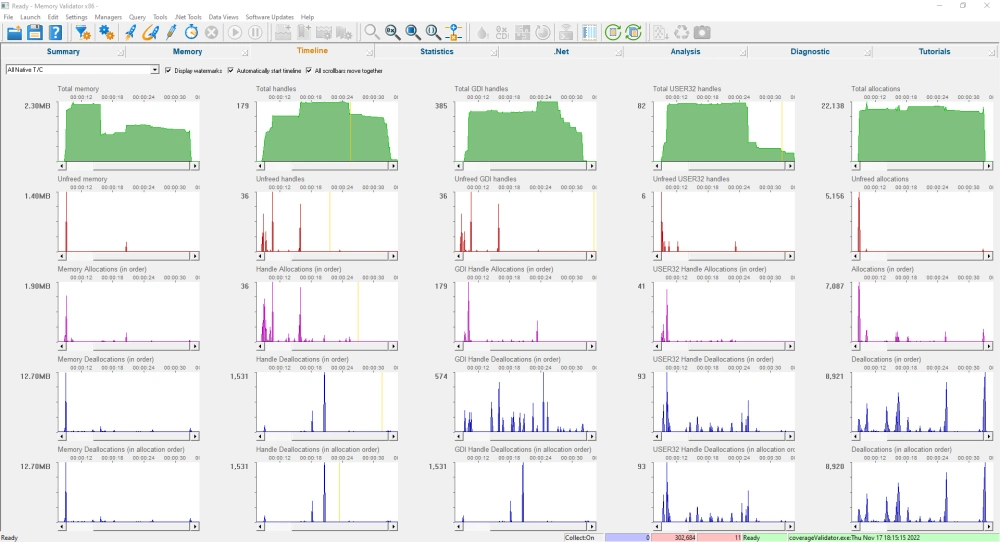
The above timeline shows all native memory and native handle allocation activity.
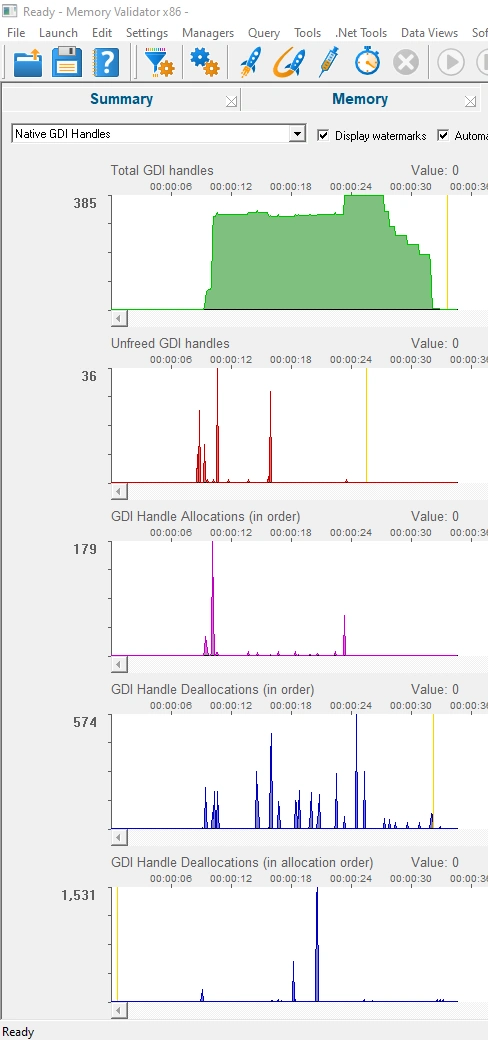
The above timeline shows all native GDI handle allocation activity.
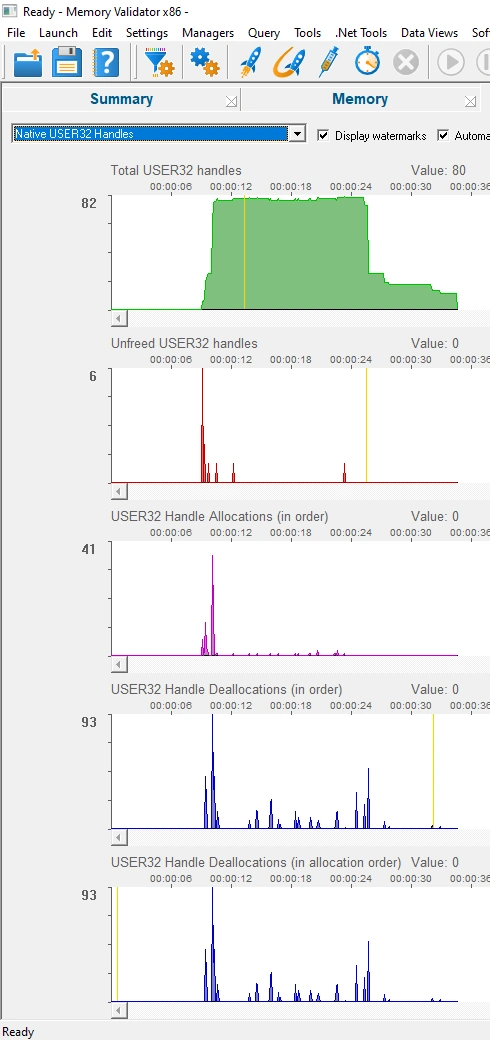
The above timeline shows all native USER32 handle allocation activity.
Statistics / Types
The Types display has had an additional Allocator combo box added which allows you to choose from many types of allocator. When an allocator is chosen, the types allocated by that allocator are displayed.
The following types are available.
| All | All types |
| All Native Memory | All native memory types |
| All Native Handles | All native handle types |
| All .Net | All .Net types |
| CRT | All types from CRT allocations |
| Heap | All types from HeapAlloc allocations |
| LocalAlloc | All types from LocalAlloc allocations |
| GlobalAlloc | All types from GlobalAlloc allocations |
| SysAllocString | All types from SysAllocString allocations |
| CoTaskMemAlloc | All types from CoTaskMemAlloc allocations |
| IMalloc | All types from allocations tracked by IMalloc |
| NetApi | All types from NetAPI allocations |
| Miscellaneous | All types from Misc allocations |
| VirtualAlloc | All types from VirtualAlloc allocations |
| VirtualAllocEx | All types from VirtualAllocEx allocations |
| VirtualAllocVlm | All types from VirtualAllocVlm allocations |
| User Defined (API) | All types from allocations reported by the User Defined Types API |
| Custom Hook | All types from allocations tracked by the Custom Hooks settings |
| COM | All types from COM allocations |
| COM AddRef | All types from COM AddRef tracking |
| OpenGL | All types from OpenGL allocations |
| CryptAPI | All types from Crypt API allocations |
| Handle | All types from handles not represented by other allocators in this list |
| GDI Handle | All types from GDI handle allocations |
| USER32 Handle | All types from USER32 handle allocations |
| Internet Handle | All types from internet related allocations (socket, WinHttp…) |
| Printer Handle | All types from WinSpool allocations |
| Fortran | All types from Fortran allocations |
| Delphi | All types from Delphi allocations |
| .Net Object | All types from .Net objects |
| .Net Large Object | All types from .Net large objects (>= 85,000 bytes in size) |
| .Net Handle | All types from .Net handles |
| .Net VTable | All types from .Net VTables |

The image above shows the Types display displaying allocations for GDI handles.
Statistics / Sizes
The Sizes display has had an additional Allocator combo box added which allows you to choose from many types of allocator. When an allocator is chosen, the sizes allocated by that allocator are displayed.

The image above shows the Sizes display displaying allocations for the HeapAlloc family of memory allocators.
Statistics / Locations
The Locations display has had an additional Allocator combo box added which allows you to choose from many types of allocator. When an allocator is chosen, the locations where allocations occur using that allocator are displayed.
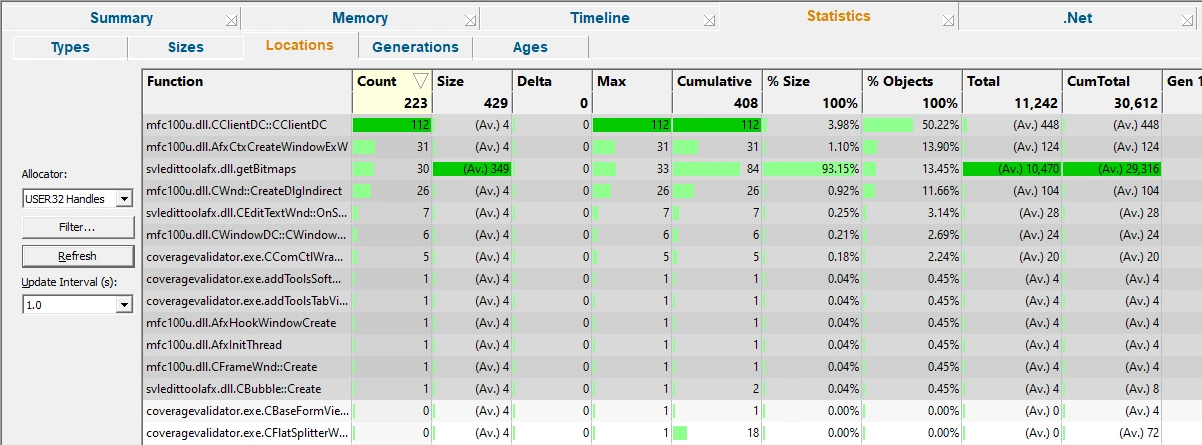
The image above shows the Locations display displaying allocations for the USER32 handles.
Statistics / Generations
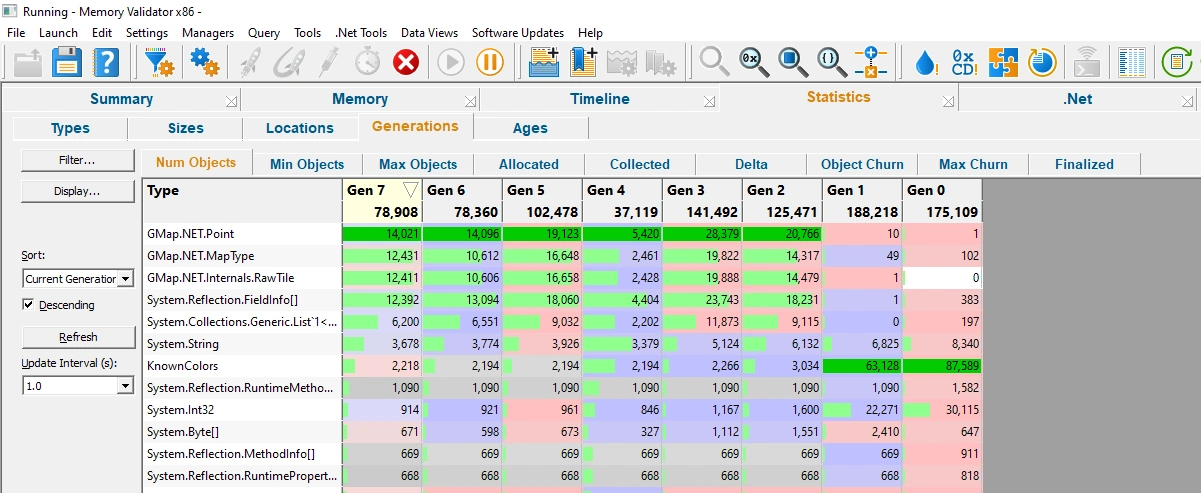
The Generations tab has a minor UX change, rearranging the control elements to the left hand side to be consistent with the Types, Sizes and Locations tabs.
Statistics / Ages
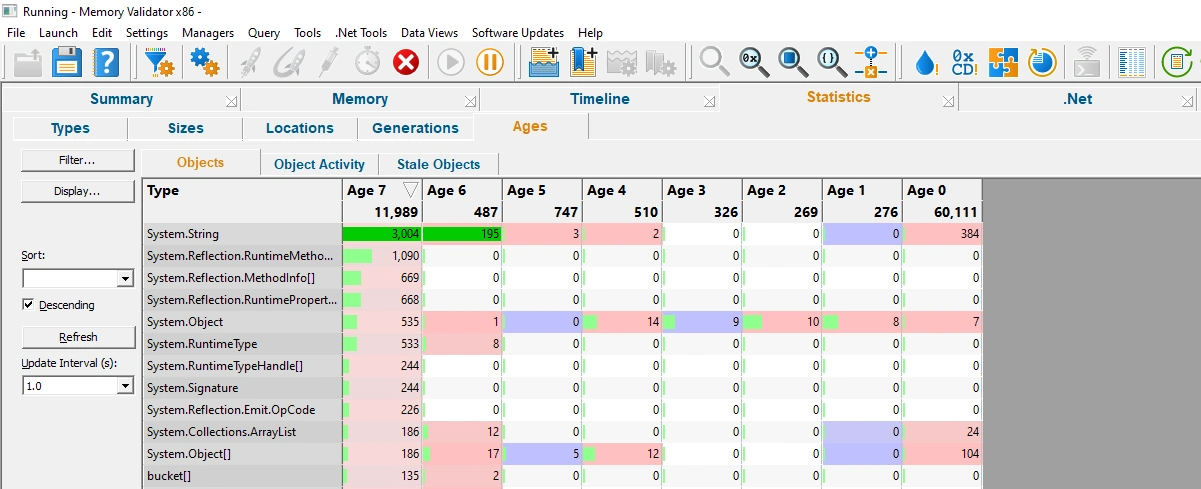
The Ages tab has a minor UX change, rearranging the control elements to the left hand side to be consistent with the Types, Sizes and Locations tabs.
Conclusion
These new statistics allow you more easily inspect data as your program executes, and after it has finished executing.
The timeline graphs allow you to easily spot allocation trends that go up but don’t come down. Is this a memory leak (a bug fix is required) or is this memory that has been held on to for too long, but which will eventually be released (an opportunity for an optimization)? The two types of deallocation graph allow you to spot when you are deallocating in the same order as the allocations, in the reverse order to the allocations, or in random order. This allows scope for improving the performance of your software by helping the memory allocator.