Minidump Browser
Minidump Browser is a software tool that allows to you to examine the contents of a minidump. The minidump might result from an application crash or a minidump created as part of some application profiling.
Typically the only way to interact with a minidump is to load it into a debugger and see where the application that generated the minidump crashed.
But minidumps can be generated without a crash being required, and crash minidumps can contain a lot more information than just information about an exception.
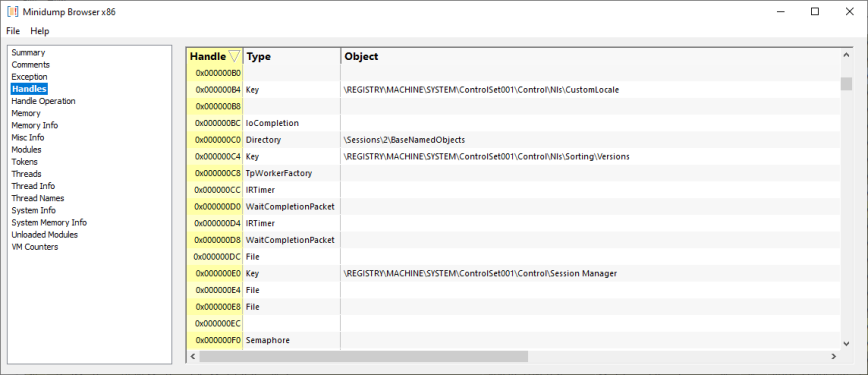
That’s why we created Minidump Browser. Now you can inspect memory protection regions, thread information, including thread names, open handles at the time of the crash, and various information about the host computer hardware, and it’s performance.
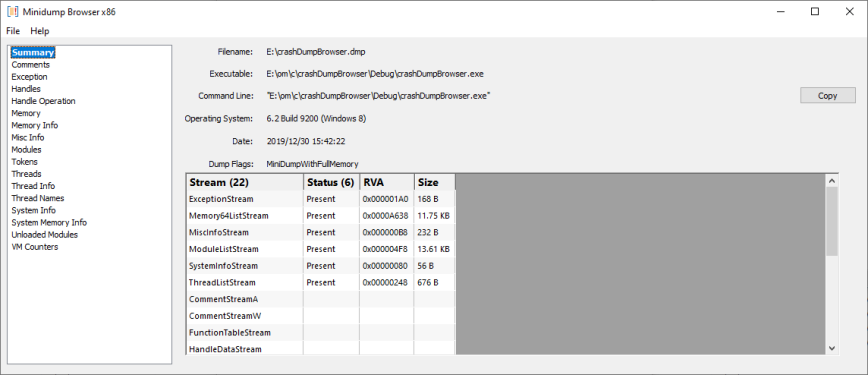
Processor architectures
Minidumps from both x86 and x64 processors are supported.
For any minidumps that refuse to load, which is typically caused by unsupported data sizes for particular sections of a minidump, we can also display those minidumps. This allows us to display minidumps from ARM and IA64 systems.
Exception
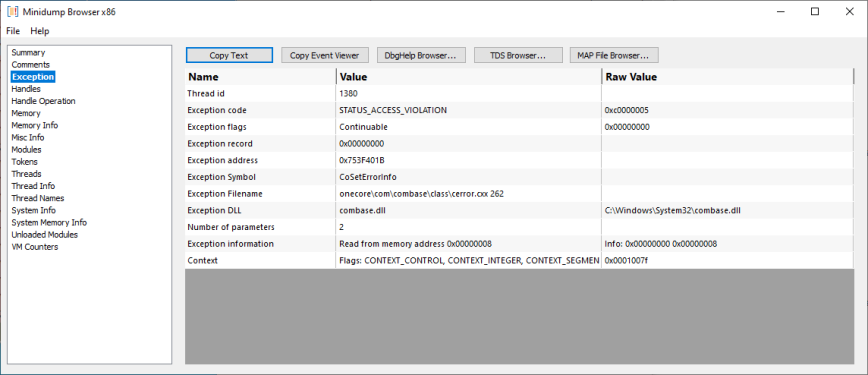
We display the exception information plus some additional information we can calculate: symbol name, filename, line number, DLL name.
You can copy the exception details to a text file, or use DbgHelp Browser, TDS Browser, Map File Browser to find the crash address details (symbol name, filename, line number) in debugging information.
Handles
Memory Info
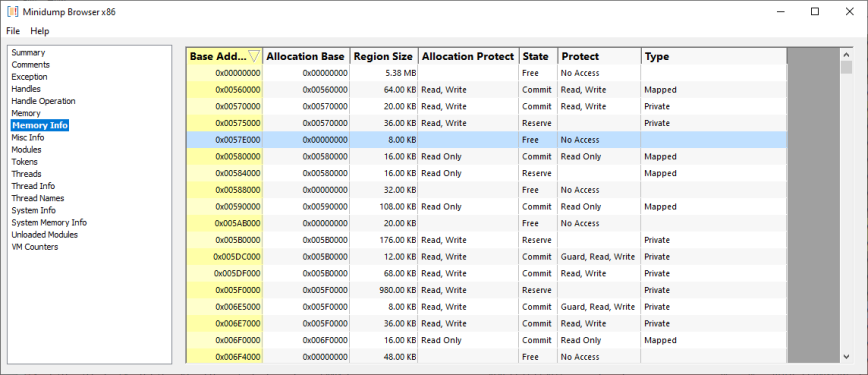
If you’re curious about visualising these memory protections, load your minidump into VM Validator.
Misc Info
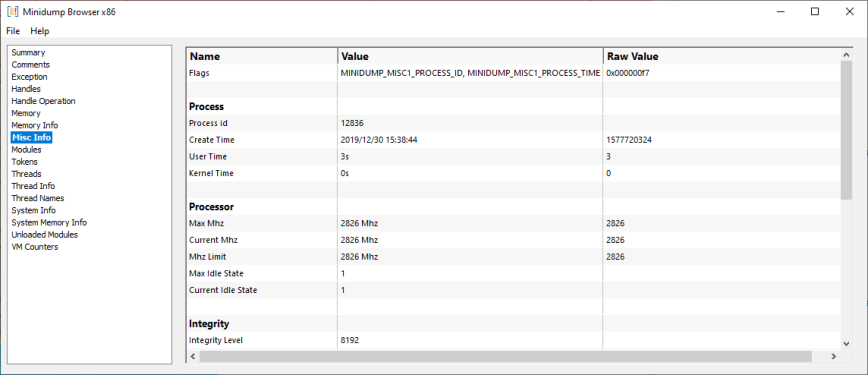
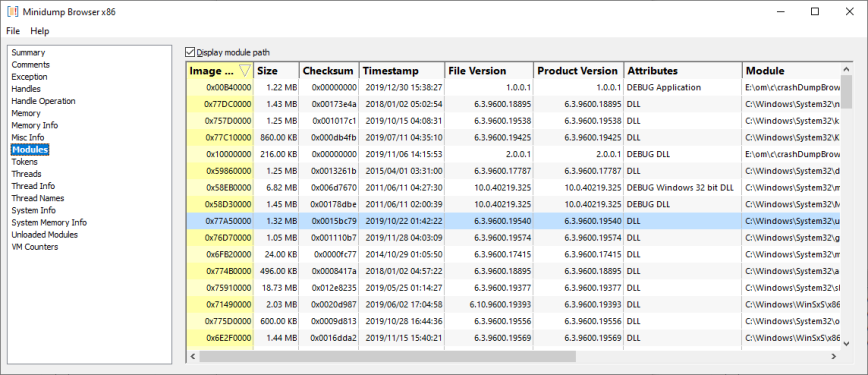
Modules
Threads
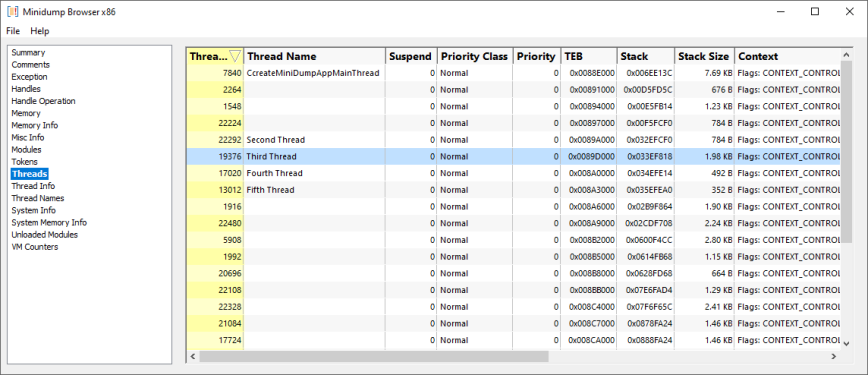
Learn more about how to name Threads.
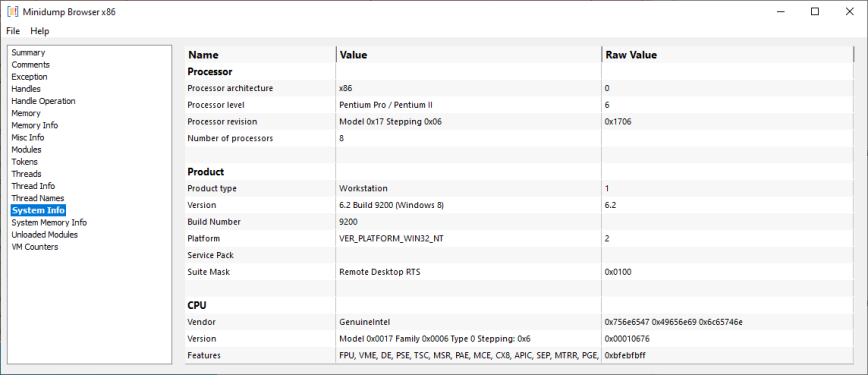
System Info
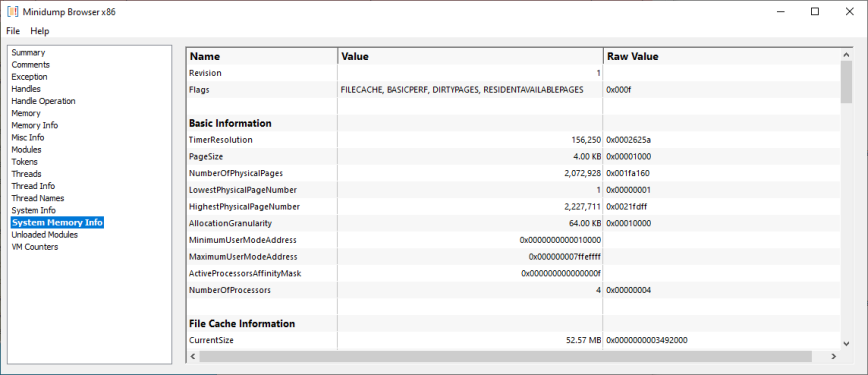
System Memory Info
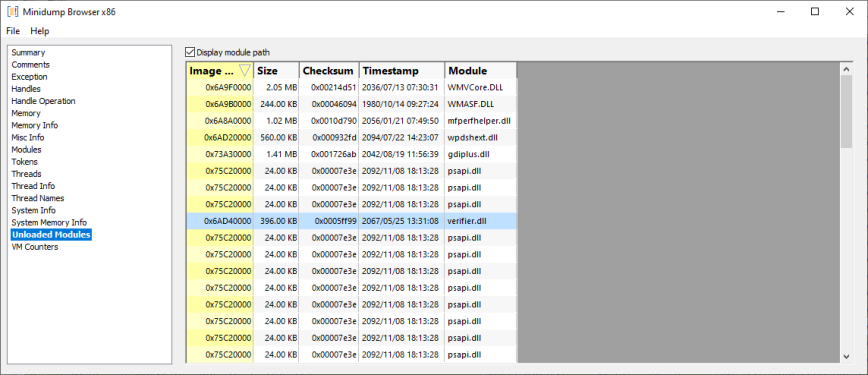
Unloaded Modules
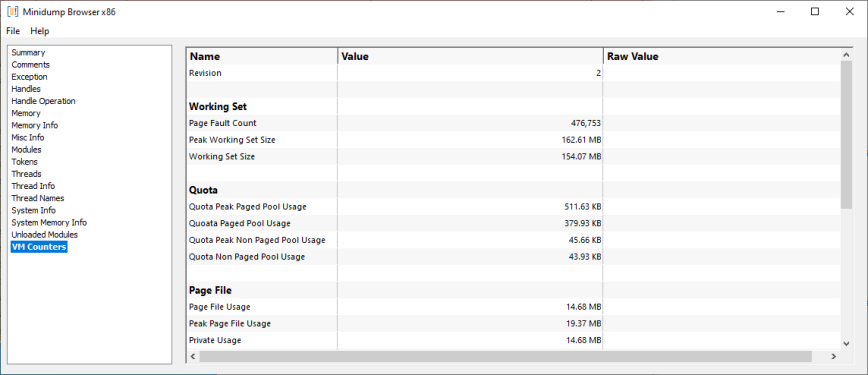
VM Counters
Viewing the virtual memory in a minidump
To view the virtual memory described by data in a minidump you need to load the minidump into Virtual Memory Validator.