Filter definitions
Filter definitions consist of a set of criteria or rules by which you can exclude data from the various main tab views.
You can filter the data by many characteristics, including:
•Full or partial callstack matching
•Callstack symbol location details such as name, class, file, directory and DLL
•Memory and handle allocation criteria
•Object attributes such as size, type and address
Global filters, session filters and local filters all use the filter definition dialog to create or modify a filter.
The filter definition dialog
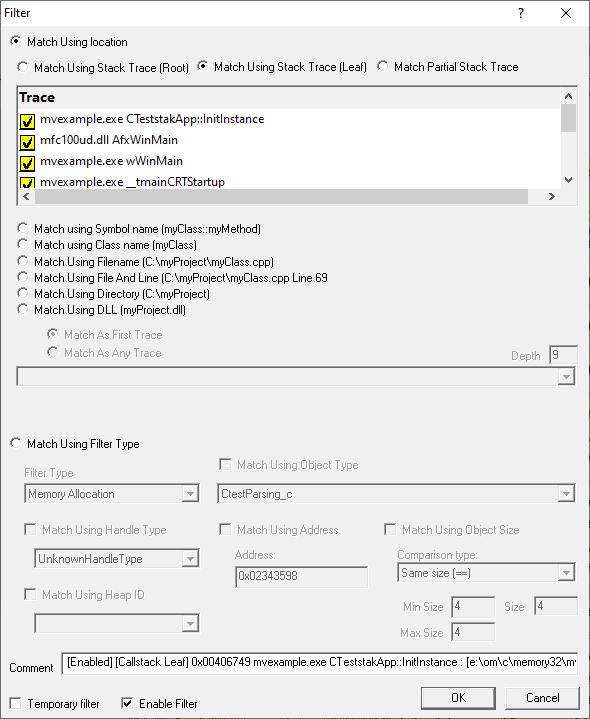
The filter definition dialog appears as shown below left, when you first create a new local, session or global filter.
However, it's much easier to create and edit a filter directly from an existing data item displayed in the Memory or Analysis tab.
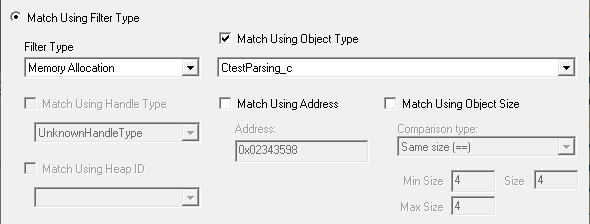
The example on the right below has pre-populated filter options for callstack, object type, size, address and other useful data to filter on.


The options above may look complex, but you don't need to set all the options here - just focus on which of the criteria you want to filter by.
Filter by location or type
The dialog is split vertically into two halves: location-based options at the top and type-based options at the bottom
•Match Using Location  filter using callstack location or source file location
•Match Using Filter Type  filter using memory or handle object datatype attributes
Match using location (callstacks)
When filtering by all or part of a callstack, that callstack has to come from an existing data item.
Popup menu options on the Memory tab and Analysis tab can create filters using the callstack of the data item.
Having first created a local, session or global filter this way, you can then edit the filter to change exactly how much of the callstack the filter needs to match.
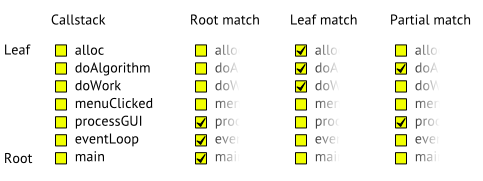
There are three ways to match by callstack: root, leaf and partial, each of which is illustrated below.

•Match Using Stack Trace (Root)  filter callstacks containing at least the root through all the selected functions
Ticking a box automatically ticks all items between it and the root.
Unticking a box unticks all items between it and the leaf
•Match Using Stack Trace (Leaf)  filter callstacks containing at least from the leaf through all the selected functions
Ticking a box automatically ticks all items between it and the leaf.
Unticking a box unticks all items between it and the root.
•Match Partial Stack Trace  match any callstack containing at least the selected functions
You can tick any boxes in any order, and they don't have to be contiguous.
Filtered items can have the selected items anywhere in their callstack.
Match using location (source)
Match using...
•Symbol name  match a selected function name or class::method name from the dropdown list
•Class name  match a selected class name from the dropdown list
•Filename  match a source file from the list
•File and line  match a source file and line number
The list contains combinations of all known allocation points in the source files for the target program
•Directory  match a directory file from the list
•DLL  match a DLL from the list
The list contains DLLs loaded by the target program as well as the target executable itself
You can choose how much in the callstack is compared to find the selected item. The measure is from the leaf callstack position (see diagram above)
•Match As First Trace  looks for the selected item only at the leaf position
•Match As Any Trace  looks at within N levels from the leaf position
Enter the Depth (on the right) within which to match the selected item
Match using filter type
Instead of filtering by callstack location, you can filter according to
•attributes of the object being allocated
•the type of item in the display

First you need to decide what type of filter you want to create.
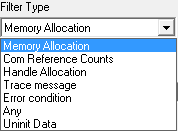
•Filter Type  choose a type of filter from the list below

Changing the filter type enables other parts of the dialog so you can set specific filter values.
When the filter type is set to Memory Allocation, you can target the filter with object type, size and address.
Some of the filter types simply allow you to include or exclude these types of items in the display.
Match using object type
•Match Using Object Type  choose a type from the Object Type dropdown list
Match using object size
•Match Using Object Size  choose from the Comparison type dropdown list and a size, or size range
You can match exact sizes, greater than or less than a size, or inside or outside a range
 Remember filters exclude data, so take care with your logic on this (and other) options!
Match using address
Matching address is useful if want to select a particular COM Object for example, so that all AddRef(), Release() and QueryInterface() calls can be shown.
•Match Using Address  enter a specific allocation address to match against
Combined with the Invert Match option below, this option is great for displaying data about just one particular object.
Match using handle or heap
When the filter type is set to Handle Allocation, you can filter by handle type and/or heap id.
•Match using Handle Type  select the type of handle to filter
Common resource handles might be Bitmap, Brush, Font etc, but there are a host of other handle types in the list.
•Match using Heap ID  select the id of the heap to filter, if any have been created
If a heap has been named, the heap name will be shown in the list instead of the heap ID
Other Match types
Other filter types include trace messages, error conditions, uninitialised data and COM reference counts.
These types have no further options necessary to filter the relevant data out of a display.
Filter Details
Finally, the details at the bottom let you add a comment to the filter and control how the filter gets applied, if at all.

•Comment  enter a description of the filter to show in group filter lists
Usually the comment is auto-generated from the selected filter options, but you can add your own touch here!
•Temporary Filter  set the filter to be temporary - meaning it won't be saved
•Enable Filter  enables and disables the filter

