The summary display provides several different layout methods
•Adaptive (Mixed)
•Adaptive (Layered)
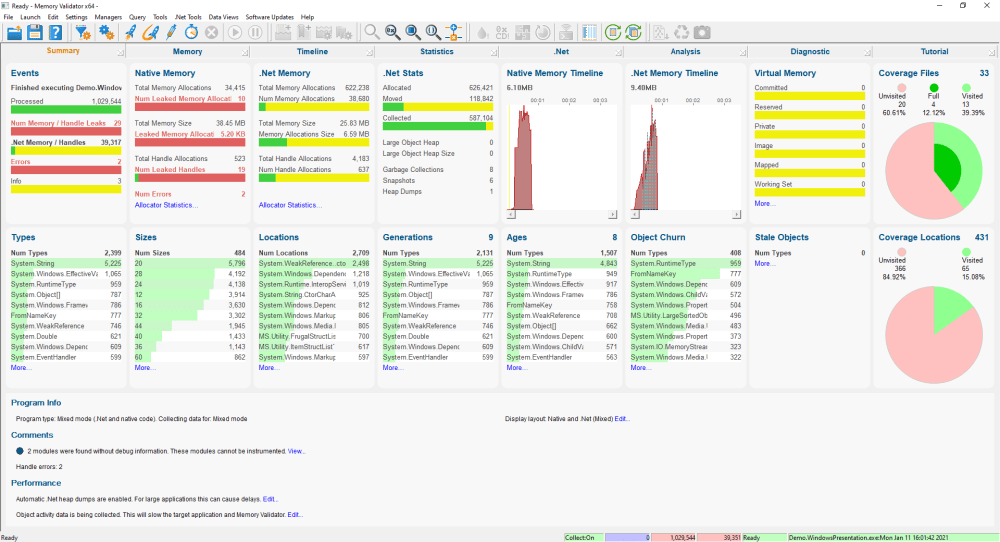
•Native and .Net (Mixed)
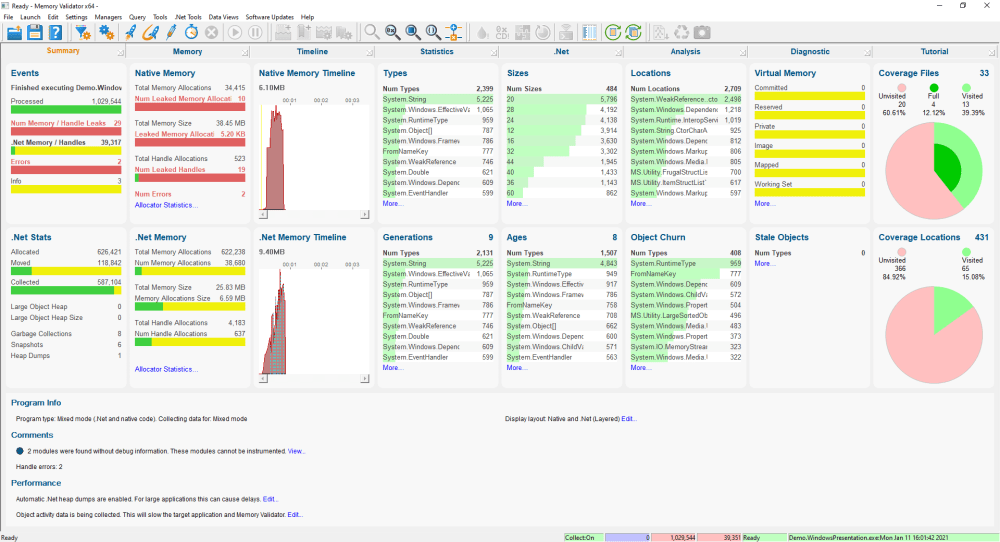
•Native and .Net (Layered)
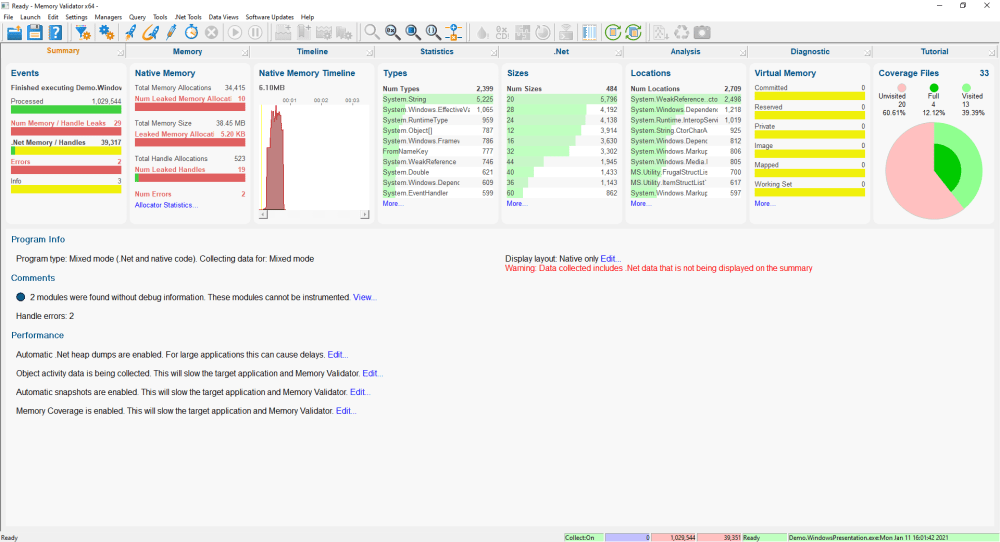
•Native only
•.Net only (minimal set of panels)
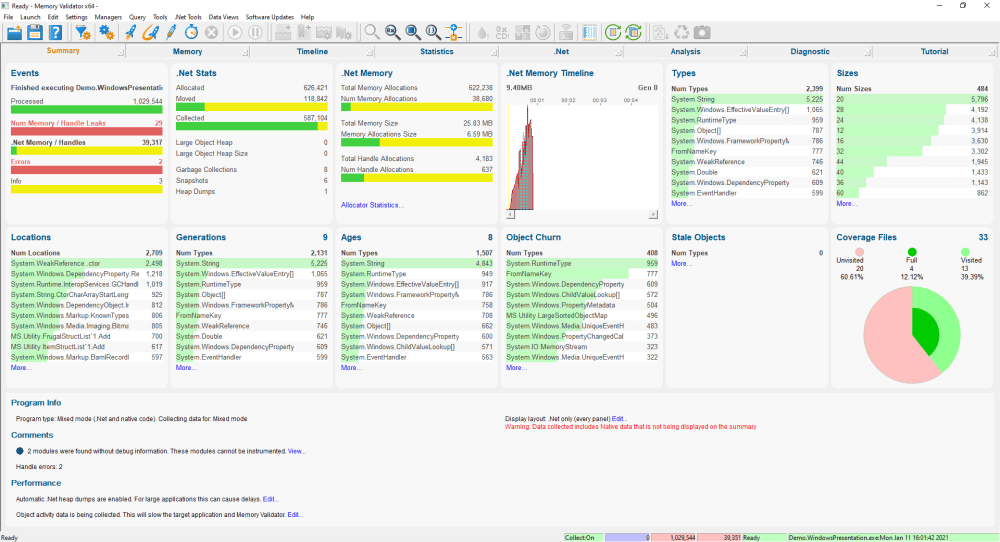
•.Net only (all .Net related panels)
Setting the summary display layout
To set the Summary display layout
 Settings menu
  Summary Display Layout...
  shows the Summary display layout chooser dialog
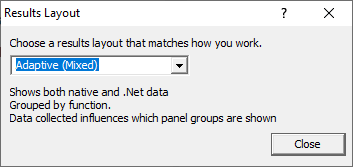
Changing the layout changes how the summary display arranges it's panels.
Two of the layouts are adaptive and change in response to the data collected and also to the data collection settings (when there is no data collected).
Examples of each layout are shown below.
Adaptive (Mixed)
The display shows all native and .net panels, arranged so that all the statistics groups are on the bottom layer and all other statistics are on the top layer.
For mixed mode applications, both native and .Net panels are shown.
For native applications only native panels are shown. For .Net applications only .Net panels are shown.
Adaptive (Layered)
The display shows all native and .net panels, arranged so that all native statistics are on the top layer and all .Net statistics are on the bottom layer.
For mixed mode applications, both native and .Net panels are shown.
For native applications only native panels are shown. For .Net applications only .Net panels are shown.
Native and .Net (Mixed)
The display shows all native and .net panels, arranged so that all the statistics groups are on the bottom layer and all other statistics are on the top layer.
 Types, Sizes and Locations apply to both native data and .Net data.
Native and .Net (Layered)
The display shows all native and .net panels, arranged so that all native statistics are on the top layer and all .Net statistics are on the bottom layer.
 Types, Sizes and Locations apply to both native data and .Net data.
Native only
The display shows only native panels.
.Net only (minimal set of panels)
The display shows only .Net panels. A minimal selection of panels has been selected so that they fit on one line.
.Net only (all .Net related panels)
The display shows only .Net panels. All relevant .Net panels are shown, resulting in a two line display.


