The Pages tab displays a tabular representation of all the memory in the target program. This is known as the pages view.

The pages view displays information about a process's virtual memory usage whilst the process is running. If there is no target program being monitored, the pages view does not display any data.
The data displayed is data per virtual memory page (as defined by the operating system). For 32 bit x86 Windows Operating Systems a page is 4Kb.
Filtering
The displayed data can be filtered by Type and by Working Set.

Type
Filtering by type filters memory for the following types of memory:
•All. All types of memory.
•Committed. Committed memory.
•Reserved. Reserved memory.
•Free. Free memory.
•Private. Memory private to this application.
•Image. Executable files (EXE, DLL, etc).
•Mapped. Memory mapped files.
•Stack. Memory used for thread stacks.
•Shareable. Memory shared with other applications.
•Swapped. Memory swapped in/out of memory.
•Wasted. Memory allocated by VirtualAlloc() but not available to the application to use. What is wasted memory?

The above image shows the pages display filtered by Private memory, showing memory that is in the working set and memory that is not in the working set.
Working Set
Filtering by working set filters memory for the following working set criteria:
•All. Displays all memory.
•Working Set. Only displays memory that is in the working set.
•Not Working Set. Only displays memory that is not in the working set.

The above image shows the pages display showing memory that is in the working set.
Sorting
Each column can be sorted by clicking the column header to move sorting to that column. Clicking the current column header again reverses the sort direction.
Context menu
A context menu is available to allow DLL inspection using PE File Browser, and to copy the DLL name to clipboard.

Viewing swap behaviour
To view virtual memory being swapped select the Swap column so that the sort arrow points downwards.
The display will show pages that have been swapped with the number of times they have been swapped shown in the Swap column.
When a page gets swapped it will be promoted at the top of the swap column for 1 second then be displayed back in it's regular sorted position.
When combined with the highlight swapped memory option on the Display Settings dialog you can very easily see pages being swapped.
View data
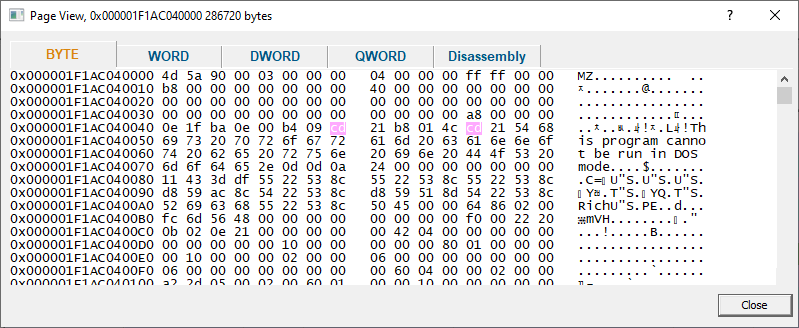
Clicking View data... opens a memory inspection dialog, allowing you to view the memory as BYTEs, WORDs, DWORDs or QWORDs.
