Instrumentation Log Data
It can be very useful to know why your code hasn't been instrumented. For example, a file or part of a file you were expecting to receive coverage information may have been excluded by one or more of the class, file, DLL or or other filters in the Global Settings dialog.
To log details of why dlls, source files, classes, methods and functions are not instrumented, first switch on the instrumentation logging settings.
Once enabled, and a session has started, you can view a list of the files that have not been instrumented via the Tools menu.
 Tools menu
  Instrumentation Logging Data... shows the Instrumentation Log Data dialog
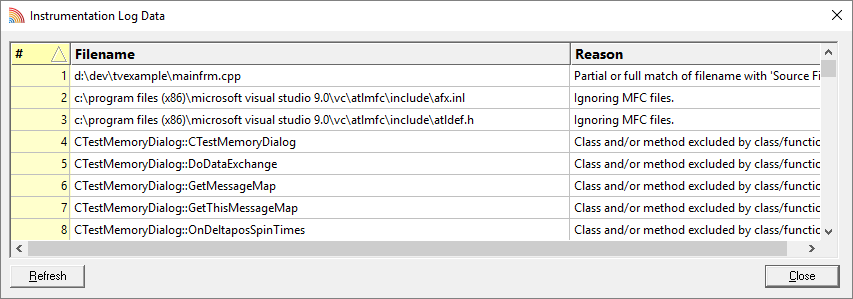
The dialog shows:
•log order
•the name of the item that hasn't been instrumented
•the reason why each item wasn't instrumented
Example reasons why an item might not be instrumented include the following:
•MFC file ignored
•Microsoft C Runtime file ignored
•Microsoft DLL ignored
•CRT DLL ignored
•Software Verify's own DLL ignored
•Class or function excluded by class and function filters
•File extension excluded by hook source file type filters
•Files excluded by source files filters