Unusual Memory Bit Patterns
Software development is an intellectual challenge. Sometimes the process is interrupted by software failures and/or crashes. A lot of the time the reason for the failure is self-evident and easily fixable. However, the reason for some crashes is less obvious and often the only clue is an unusual bit pattern that is typically present each time the crash happens.
This article will describe some of the common bit patterns (also known as debug magic numbers or just magic numbers) that have been used in Windows C/C++ software. After describing the bit patterns we’ll explain various simple rules you can follow in your software development that will make encountering these problems much less likely.
All of these bit patterns apply to the Microsoft C/C++ compiler that ships with Visual Studio (6.0 through 2010) and any compatible compilers (such as the Intel compiler). These bit patterns are found in debug builds. Release builds do not use special bit patterns.
These bit patterns evolve and change as the C runtime internals change from managing memory themselves to handing that management over to the Win32 heap family functions HeapAlloc(), etc.
Some of the allocators appear to know if they are running with a debugger present and change their behaviour so that with a debugger present you will see the bit patterns, and without the debugger present you will not see the bit patterns. HeapAlloc(), LocalAlloc(), GlobalAlloc() and CoTaskMemAlloc() both exhibit this behaviour.
0xcccccccc
32 bit: 0xcccccccc
64 bit: 0xcccccccccccccccc
The 0xcccccccc bit pattern is used to initialise memory in data that is on the stack.
void uninitFunc_Var()
{
    int r;

    // here, r has the value 0xcccccccc

    …
}
Also, consider this C++ class.
class testClass
{
public:
    testClass();

    DWORD getValue1();

    DWORD getValue2();

private:
    DWORD value1;
    DWORD value2;
};

testClass::testClass()
{
    value1 = 0x12345678;

    // whoops!, forgot to initialise “value2”
}

DWORD testClass::getValue1()
{
    return value1;
}

DWORD testClass::getValue2()
{
    return value2;
}
When an object of type testClass is created on the stack, its data member “value2” is not initialised. However, the debug C runtime initialised the stack contents to 0xcccccccc when the stack frame was created. Thus if the object is used, its data member “value2” will have a value of 0xcccccccc, and “value1” will have a value of 0x12345678.
void uninitFunc_Object()
{
    testClass tc;

    // here, tc.value1 has the value 0x12345678
    // here, tc.value2 has the value 0xcccccccc because it was erroneously not initialised in the constructor

    …
}
If you are seeing the 0xcccccccc bit pattern it means that you are reading memory that is on the current thread stack that has not been initialised.
Why is the pattern 0xcccccccc used? This pattern is four bytes of 0xcc. The Intel i386 opcode 0xcc is a breakpoint. Filling the stack with breakpoint instructions for uninitialised data is an interesting choice. Perhaps if a stack corruption occurs and data on the stack starts getting executed there is a slightly greater chance you’ll hit a breakpoint? I don’t know if this was the compiler designer’s intention or just that they chose to use a similar value to the dynamic memory uninitialised value of 0xcd (which we’ll describe later in this article).
0xbaadf00d
32 bit: 0xbaadf00d
64 bit: 0xbaadf00dbaadf00d
The 0xbaadf00d bit pattern is the bit pattern for memory allocated with HeapAlloc(), LocalAlloc(LMEM_FIXED), GlobalAlloc(GMEM_FIXED).
If you are seeing the 0xbaadf00d bit pattern it means that you are reading memory that has been allocated by HeapAlloc() (or reallocated by HeapReAlloc()) and which has not been initialised by the caller of HeapAlloc (or HeapReAlloc, LocalAlloc, GlobalAlloc).
0xdeadbeef
32 bit: 0xdeadbeef
64 bit: 0xdeadbeefdeadbeef
The 0xdeadbeef bit pattern is the bit pattern for memory deallocated using HeapFree(), LocalFree(), and GlobalFree().
If you are seeing the 0xdeadbeef bit pattern it means that you are reading memory that has been deallocated by HeapFree(), LocalFree() or GlobalFree().
Note: In recent tests it seems that you are more likely to see 0xfeeefeee than 0xdeadbeef.
0xabababab
32 bit: 0xabababab
64 bit: 0xabababab
The 0xabababab bit pattern is the bit pattern for the guard block after the memory is allocated using HeapAlloc(), LocalAlloc(LMEM_FIXED), GlobalAlloc(GMEM_FIXED) or CoTaskMemAlloc(). The guard region seems to be a minimum of 4 bytes, but can be much larger (I suspect it ends when the size of the allocated block plus the guard block reaches a particular size).
If you are seeing the 0xabababab bit pattern it means that you are reading memory after a memory block that has been allocated by HeapAlloc(), LocalAlloc(LMEM_FIXED), GlobalAlloc(GMEM_FIXED) or CoTaskMemAlloc().
0xbdbdbdbd
32 bit: 0xbdbdbdbd
64 bit: 0xbdbdbdbd
The 0xbdbdbdbd bit pattern is the guard pattern around memory allocations allocated with the “aligned” allocators. The guard region is the same size (4 bytes) on both x86 and x64 systems.
Memory allocated with malloc(), realloc(), new and new [] is provided with a guard block before and after the memory allocation. When this happens with an aligned memory allocator, the bit pattern used in the guard block is 0xbdbdbdbd.
If you are seeing the 0xbdbdbdbd bit pattern it means that you are reading memory before the start of a memory block created by an aligned allocation. This guard pattern is present only for debug allocators.
0xfdfdfdfd
32 bit: 0xfdfdfdfd
64 bit: 0xfdfdfdfd
The 0xfdfdfdfd bit pattern is the guard pattern around memory allocations allocated with the “non-aligned” (default) allocators. The guard region is the same size (4 bytes) on both x86 and x64 systems.
Memory allocated with malloc(), realloc(), new and new [] is provided with a guard block before and after the memory allocation. When this happens with a non-aligned (default) memory allocator, the bit pattern used in the guard block is 0xfdfdfdfd.
If you are seeing the 0xfdfdfdfd bit pattern it means that you are reading memory either before the start of a memory block or past the end of a memory block. In either case, the memory has been allocated by malloc(), realloc() or new. This guard pattern is present only for debug allocators.
0xcdcdcdcd
32 bit: 0xcdcdcdcd
64 bit: 0xcdcdcdcdcdcdcdcd
The 0xcdcdcdcd bit pattern indicates that this memory has been initialised by the memory allocator (malloc() or new) but has not been initialised by your software (object constructor or local code).
If you are seeing the 0xcdcdcdcd bit pattern it means that you are reading memory that has been allocated by malloc(), realloc() or new, but which has not been initialised.
0xdddddddd
32 bit: 0xdddddddd
64 bit: 0xdddddddddddddddd
The 0xdddddddd bit pattern indicates that this memory is part of a deallocated memory allocation (free() or delete).
If you are seeing the 0xdddddddd bit pattern it means that you are reading memory that has been deallocated by free() or delete.
This value is more likely to be seen when you are not using a debugger (the underlying heap uses different values when the debugger is present – this behaviour is different for different versions of Visual Studio and the operating system).
0xfefefefe
32 bit: 0xfefefefe
64 bit: 0xfefefefefefefefe
The 0xfefefefe bit pattern indicates that this memory is part of a deallocated memory allocation (free() or delete).
If you are seeing the 0xfefefefe bit pattern it means that you are reading memory that has been deallocated by free() or delete.
0xfeeefeee
32 bit: 0xfeeefeee
64 bit: 0xfeeefeeefeeefeee
The 0xfeeefeee bit pattern indicates that this memory is part of a deallocated memory allocation (free() or delete).
If you are seeing the 0xfeeefeee bit pattern it means that you are reading memory that has been deallocated by free() or delete.
This value is more likely to be seen when you are using a debugger (the underlying heap uses different values when the debugger is present – this behaviour is different for different versions of Visual Studio and the operating system).
What can you do to prevent the cause of these problems?
Depending on the nature of the problem, it may be trivial to identify why you have an uninitialised variable or why your pointer is pointing to deallocated memory. The rest of the time you can rely on a few helpful rules and the judicious use of some software tools
Crash
When you have a crash, try to identify the cause of the crash.
- If you are in a debugger, the debugger may be able to show you variable names, thus you will be able to identify which variable is in error.
- If you are in a debugger you can view the register window to see if a register has one of these special bit patterns.
- If you have an exception report, you can view the crash address, the exception address and any registers to see if any of these special bit patterns are present.
Registers
At the start of a C++ method, the “this” pointer is stored in the ECX register (RCX on 64-bit/x64). If the ECX register contains one of these bit patterns you have a good indicator that a dangling pointer to a deleted object or an uninitialised pointer is being used. Note that depending on what the compiler does the ECX register may remain valid during the method or may take on other values and thus be unreliable as to whether it still represents the “this” pointer.
When a method or function returns, the return value is in the EAX register (RAX for 64-bit/x64).
Simple data member rules to follow
- Always initialise all data members in all your object constructors.
- Always initialise all data that is used that is not data members of class definitions.
- Always use the correct form of delete, even if you are working with intrinsic types. It is not unknown to change the type of a data member as software evolves. If you always use the correct form of delete, then a switch from (for example) “int” to a class type will not result in objects of the class type failing to be deleted.
Simple C/C++ allocator rules to follow
- If you allocate using new, deallocate with delete.
- If you allocate using new [], deallocate with delete [].
- If you allocate using malloc() or realloc(), deallocate with free().
We discuss many types of memory allocator in this article on the causes of memory leaks.
Simple pointer rules to follow
- Always set pointers to dynamically allocated data to NULL before using them (unless you are assigning them on first use).
- Always check pointers are non-NULL before you use them.
- Always set pointers to NULL after deallocating the memory pointed to by the pointer.
    delete [] accounts;
    accounts = NULL;
Do this in object destructors and anywhere else you deallocate memory. The reason you do this in object destructors is that, in release code, the memory deallocator will not overwrite the contents of the deleted object. Thus if any erroneous code is still pointing to the deleted object, it will find a NULL pointer to accounts rather than a pointer to a deleted accounts object.
- In object destructors, even if you are not deleting any objects, but you have pointers to objects, set these to NULL as well. The reason is the same reason as above – defensive programming, to minimise the likelihood that things can fail.
- If possible, try to make one location in your software responsible for the management of a particular type of object. For example, you may create a manager class that is responsible for creating, managing and destroying particular objects. If you then get a failure with a related object type, you can focus your attention on the manager class, perhaps adding additional tracing code or analysing with a software tool.
Software libraries in DLLs – rules to follow
If your software is structured so that some class implementations are in certain DLLs and other DLLs rely on those class implementations (either by usage or by derivation/inheritance) then you need to consider the following issues:
- Size If you change the size of a struct, union or class object then you will need to rebuild all other DLLs that use that struct, union or class. In theory, the Developer Studio build system should keep everything up to date. But Developer Studio can only work with the information you give it. If you have forgotten to add appropriate header files to a project the project will not consider changes to those header files. Typically we have found the simplest and easier solution is a full rebuild of any affected DLLs after a change in the size of a class object. Reasons for struct, union or class to change size:
- Change of a method from normal to virtual or virtual to normal.
- Addition or removal of a virtual method.
- Addition or removal of a data member.
- Change in type of an object that is a data member of the class (for example from int to double or from weeble to wobble).
- Change in size of an object that is a data member of the class (for example data member of type testObject changes size).
- Change of #pragma byte packing for some or all of the class definitions.
- Addition or removal of base classes which the class derives from.
- Conditional compilation resulting in different data members, the same data members but different ordering or different definitions for data members.
- Macro definitions resulting in different types/sizes for data members that are not obvious. This is an obscure form of the conditional compilation problem.
A good indicator that you have forgotten to do the above is looking at the class object in the debugger and noticing that the fields all appear OK in one DLL, but when looked at from a function in a different DLL, the object fields appear to have different data. This is a sure sign that one or more DLLs have not been compiled with the same object definition.
- Dynamic memory Passing data back from DLLs can be fraught with problems. The classic problem is that A.dll calls B.dll to get some data. The data is dynamically allocated, populated with the result and passed back to the caller. The caller uses the data and then deallocates the data. The program crashes. Why? The typical reason is that the deallocator used to deallocate the memory is not the correct deallocator to match the allocator of the memory. “But! But I’m using the C runtime all the time” exclaims the hapless and confused developer. “What have I done wrong?”. Typical scenarios for this are as follows:
# Allocator Deallocator Result 1 Dynamically linked CRT (dynB.dll) Dynamically linked CRT (dynA.dll) OK 2 Dynamically linked CRT (dynB.dll) Statically linked CRT (statA.dll) Crash 3 Statically linked CRT (statB.dll) Dynamically linked CRT (dynA.dll) Crash 4 Statically linked CRT (statB.dll) Statically linked CRT (statA.dll) Crash 5 Statically linked CRT (statB.dll) Statically linked CRT (statB.dll) OK Let’s take each scenario in turn.
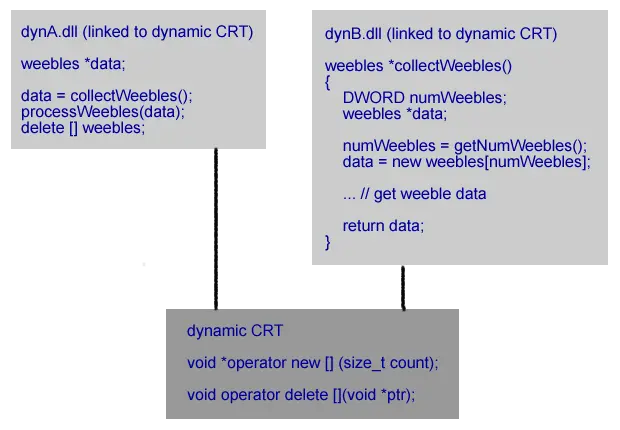 Both dynA.dll and dynB.dll are linked to the dynamic C Runtime. This means they are both using the same allocator and deallocator functions (malloc/free, new/delete) in the same C runtime DLL. That dll is used by both dynA.dll and dynB.dll. Because the same runtime is used by both dynA.dll and dynB.dll the correct deallocator is used to deallocate the memory allocated by dynB.dll. This scenario works correctly.
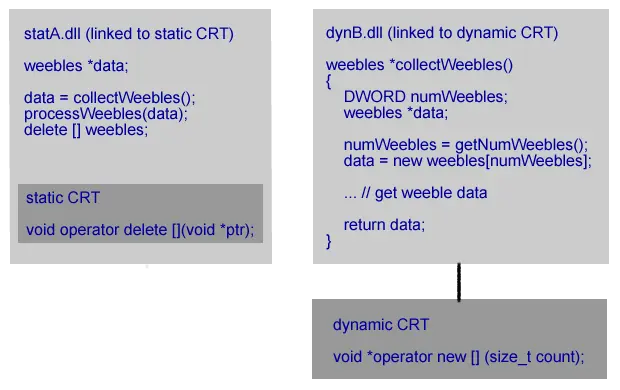 dynB.dll is linked to the dynamic C Runtime. It’s caller statA.dll is linked to the static C Runtime. The allocated memory comes from the dynamic CRT. The deallocation function is in the static CRT which uses a different heap to the dynamic CRT. The memory deallocation call fails. Most likely with a crash.
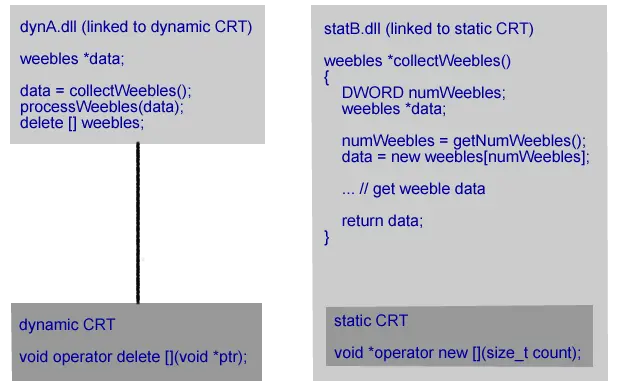 statB.dll is linked to the static C Runtime. Its caller dynA.dll is linked to the dynamic C Runtime. The allocated memory comes from the static CRT. The deallocation function is in the dynamic CRT which uses a different heap than the dynamic CRT. The memory deallocation call fails. Most likely with a crash.
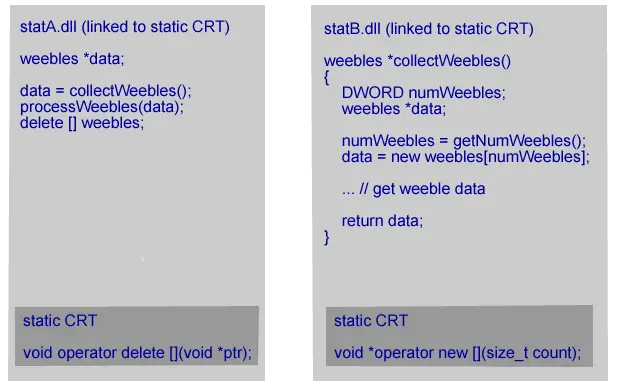 statB.dll is linked to the static C Runtime. It’s caller statA.dll is linked to the static C Runtime. The allocated memory comes from a static CRT linked to statB.dll. The deallocation function is in the static CRT linked to statA.dll which uses a different heap to the other static CRT. The memory deallocation call fails. Most likely with a crash.
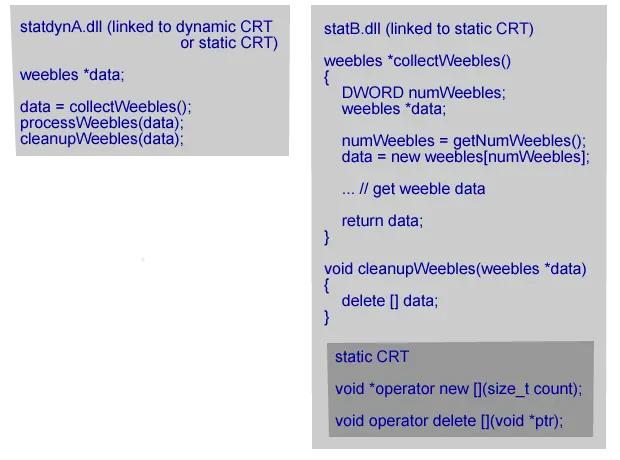 statB.dll is linked to the static C Runtime. statA.dll can be linked to the static C Runtime or the dynamic C Runtime. Memory is allocated in statB.dll, passed back to the caller, used and then passed the memory back to a function in statB.dll that calls the deallocator. That is, statB.dll has to provide an explicit cleanup function to deallocate the memory it passed back to the caller. All allocated memory is deallocated in the same DLL that it was allocated in. It doesn’t matter how the calling DLL is linked to the C Runtime. This scenario works correctly.
- ANSI / Unicode You need to ensure that APIs between DLLs use the string width (char/byte for ANSI, two-byte (wchar_t) for wide character) that each DLL expects. If you have C++ functions you’re golden as the name mangling will ensure the correct values are passed. But if you are exposing C-style APIs and calling them via GetProcAddress you had better make sure your function prototypes match the DLL otherwise you could end up passing good data to the wrong function (which will then perceive that data as bad data).
I’ve tried all the above, what other options are there?
If all else fails, then you will probably need to turn to a software tool to analyse your memory usage and identify the cause of the deleted memory that the pointer is pointing to (has the memory been deleted too early? Or is the pointer being used in error after the memory was deleted?).
In that case, you should try analysing your memory usage with Memory Validator.