C++ Deadlock detector - Thread Validator 5.81
Are you struggling to understand the multithreading behaviour of your software?
Does your software seem sluggish and slow to respond, yet the CPU usage is also low?
Do you need clarity on which locks are contended and spend too much time waiting?
Is your locking strategy correct, or is there potential for deadlocks due to incorrect locking strategy?
Are you wondering why your software is deadlocking?
Thread Validator is the tool that will let you find out.
6 Minute Video
Thread Validator is a concurrent thread analysis tool for use by software developers and software quality assurance testers. Thread deadlocks cause your application to hang, and high thread contention for critical sections can cause your application to perform poorly. Thread Validator allows you to monitor these situations and more.
Use Thread Validator to:
- Identify deadlocks in your application.
- Identify potential deadlocks in your application.
- Identify busy contended critical sections in your application.
- Identify slow critical sections in your application.
- Identify re-entered critical sections in your application.
- View thread-locking behaviour in real-time.
- Improve your software quality by modifying your threading behaviour.
- View all open handles that your application can wait on.
- Command line API to support automated use (Jenkins, etc.).
Keeping track of everything
Multi-threaded programs have many locks, handles that are waited upon, threads being scheduled and wait chains.
That’s a lot of things to track, each of them with dedicated displays to allow you to understand them properly. It’s a complex problem to keep track of.
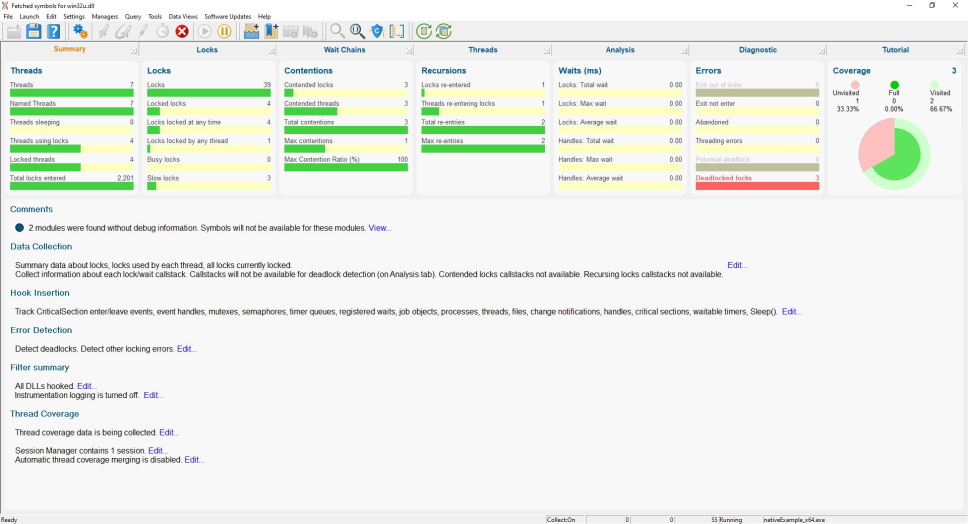
To make this easy, we’ve provided a summary display highlighting all the key statistics, from which you can easily jump to a display dedicated to that statistic.
Summary
Information is displayed in logical groupings so all thread, lock, contention, recursion, wait, error and coverage information is easy to read.
The purpose of this display is that you should be able to read this display at a glance and determine which part of the application is of interest. For most thread monitoring applications, you should be able to monitor this page until data on one of the sections indicates further investigation is needed.
The lower area displays information related to the settings used to collect this information, allowing easy surfacing of warnings and errors and direct editing of the related settings without having to open the settings editor to hunt for the appropriate setting.
Locks
Critical sections and waitable handles form the majority of an application’s synchronization work. When you see how many critical sections an application has, it can be overwhelming looking at this data. But if you provide different views for this data, it becomes more manageable.
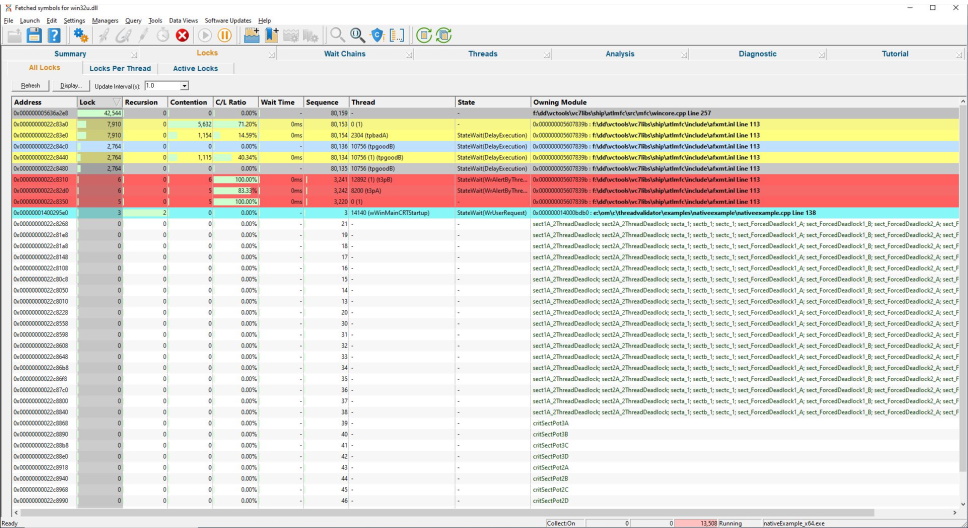
All Locks
The locks summary view shows summary information for all critical sections in the application.
Information is also shown about any wait events in progress.
Each critical section is shown once, indicating the current state of the critical section regardless of which threads are using the critical section.
Each entry is colour coded to indicate activity, contention, recursion, misc errors, potential deadlocks and deadlock conditions.
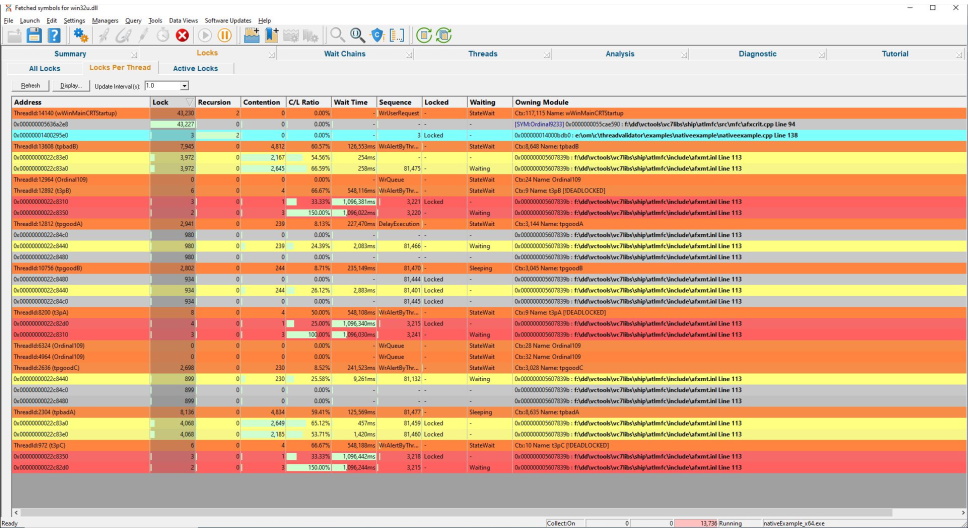
Locks per Thread
The per thread locks view shows information about each critical section and wait event for each thread in the application.
Information about each thread is shown prior to showing information about the critical sections and wait events for that thread.
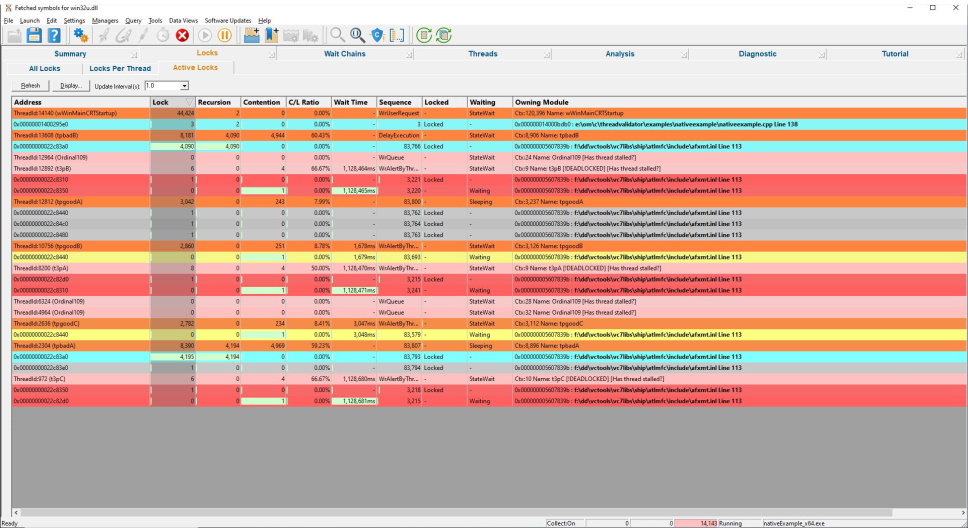
Active Locks
The active locks view shows information about each waiting critical section, each locked critical section and each wait event for each thread in the application.
Information about each thread is shown before showing information about the critical sections and wait events for that thread.
Unlike the per thread locks view, only critical sections currently locked or waiting for each thread are shown. Critical sections not involved in any locking behaviour are not displayed, making the diagnosis of deadlocks much simpler.
Wait Chains
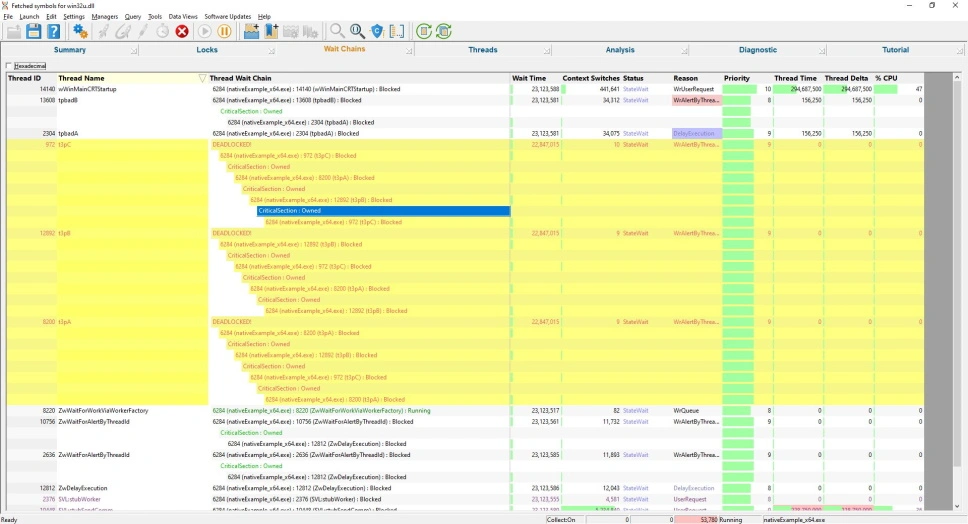
The wait chain view allows you to see which locks and handles are waiting on each other. This includes external objects such as other processes and COM objects.
Information about each thread is shown alongside information for each wait chain so that you can see a given thread’s activity (context switches, wait status, wait reason etc.).
Selecting a row will highlight related rows in yellow.
In the image to the right the three threads, t3pA, t3PB, and t3pC, are related because they are all involved in a deadlock.
Threads
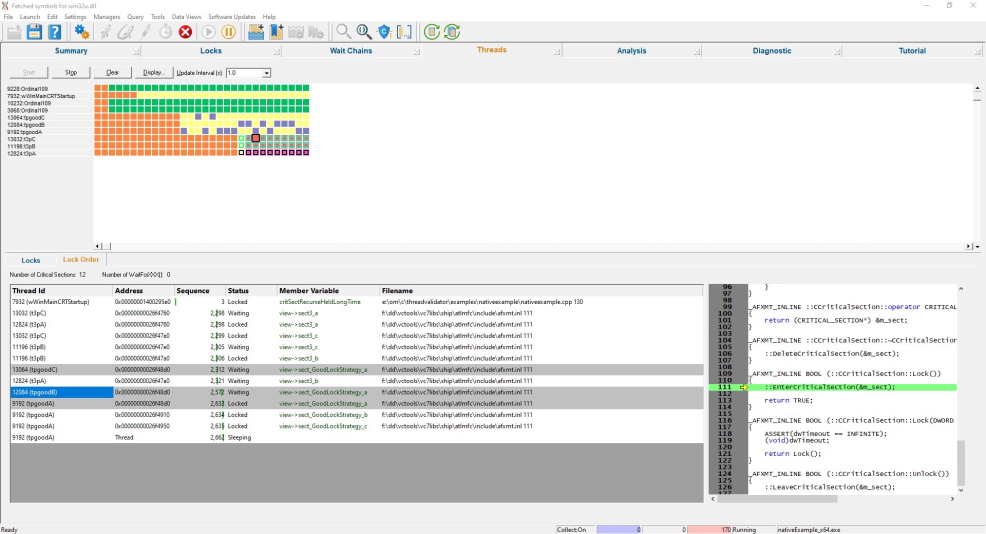
Understanding threading behaviour is easier when you have a timeline of the thread activity in the application.
Selecting an entry in the timeline displays all lock and wait information for that time period in the lower window. The displayed information is a lock summary similar to the active locks display and a lock order display allowing you to see the order the locks were acquired and which threads are using the same lock.
Thread Behaviour
Thread are displayed with their thread id and name, with each thread entry coloured according to their locking/waiting/contended status or according to any error status (misc thread errors/deadlocked/potential for deadlock).
Locks
The thread locks view shows information about each waiting critical section, each locked critical section and each wait event for the selected item in the threads timeline.
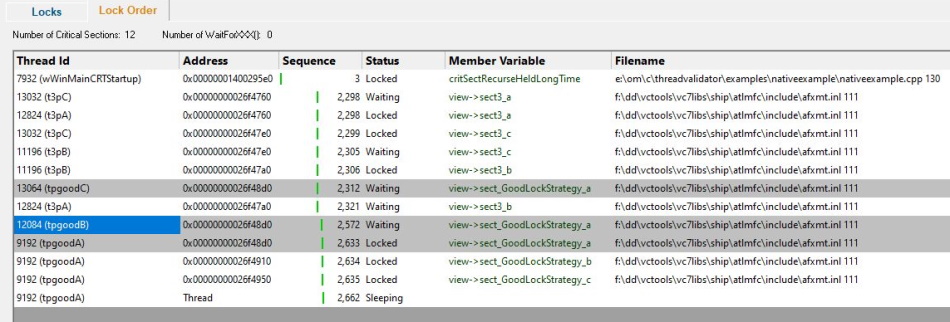
Lock Order
The lock order display shows the locks and waits in the order they were acquired.
Selecting a lock will highlight all the threads that are using the lock.
You can inspect information in this display to determine how a deadlock occurred.
Analysis
When you want to run queries or find information that isn’t available elsewhere, the Analysis view provides you with different perspectives on the data you have collected.
Query
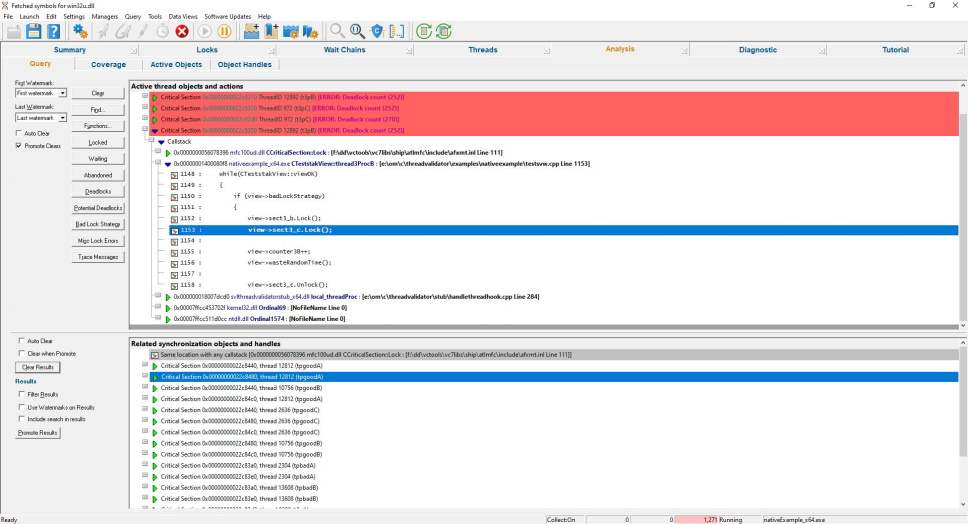
The Query view provides the ability to query for deadlocked objects, potentially deadlocked objects, waiting objects, find data based on its type, address, file, DLL and function name.
Queries can also be performed about the currently selected object (such as show other actions with the same object, same type, or other actions in the same file, DLL, class, as this action, etc.).
Once the data is found, the data can be filtered, and data related to any selected object can be shown in the lower window. Data in the lower window can then be promoted to the upper window so that the same tests can be performed on this data.
Using this iterative process, it is possible to find references to other objects, other objects involved in the same deadlock, other deadlocks caused by the same lock and so on.
Coverage
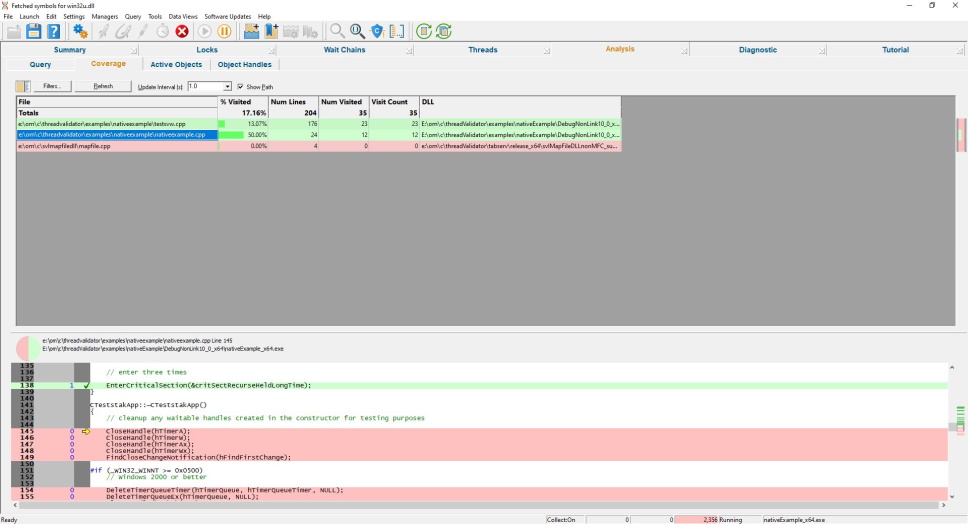
Unlike a typical code coverage tool where your synchronization object usage is lost in the general code coverage statistics, this coverage view only provides coverage for the synchronization-related code and ignores all other code for code coverage purposes, making it much easier to understand if a synchronization object has been covered or not.
What code is related to threading behaviour?
Any code that creates or destroys critical sections or other synchronization objects (Mutexes, Semaphores, Events, etc.) and any code that opens or closes handles that can be waited upon (Files, Pipes, Sockets, etc.).
If your code is multithreaded, you’ll want to know that your tests are exercising these parts of your code.
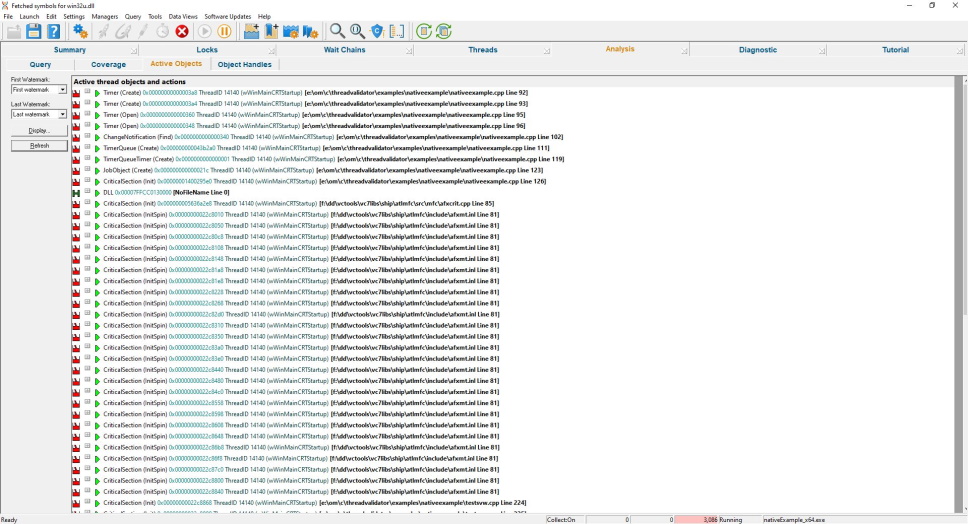
Active Objects
The Active Objects view shows information about the creation and destruction of synchronization objects in the application under test.
Miscellaneous locking errors are also reported on this view.
Events relating to the use of synchronization objects are also displayed.
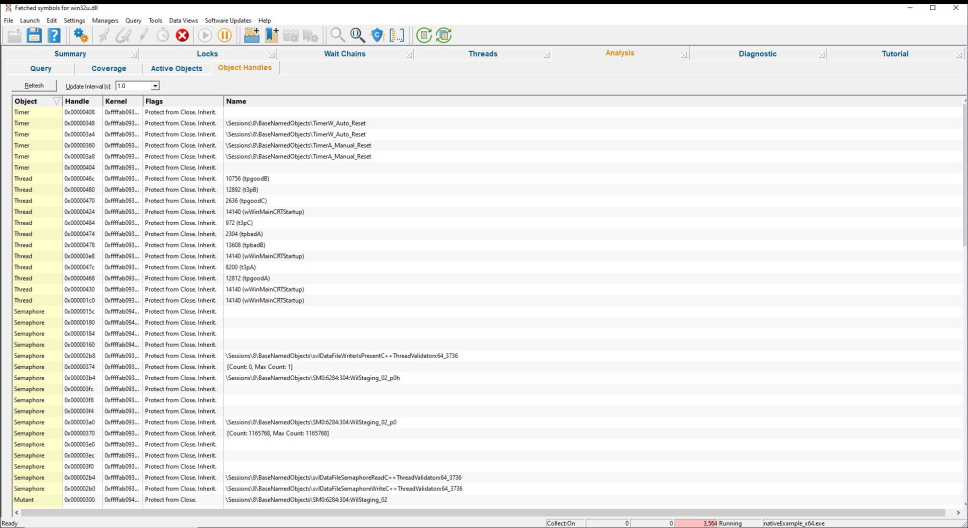
Win32 Objects
The Win32 Objects view shows statistics describing the different types of synchronization objects and the number of objects of that type currently in use.
Each entry displays the synchronization object type, its handle, the associated kernel address, any flags associated with the handle and the handle’s name.
Diagnostic
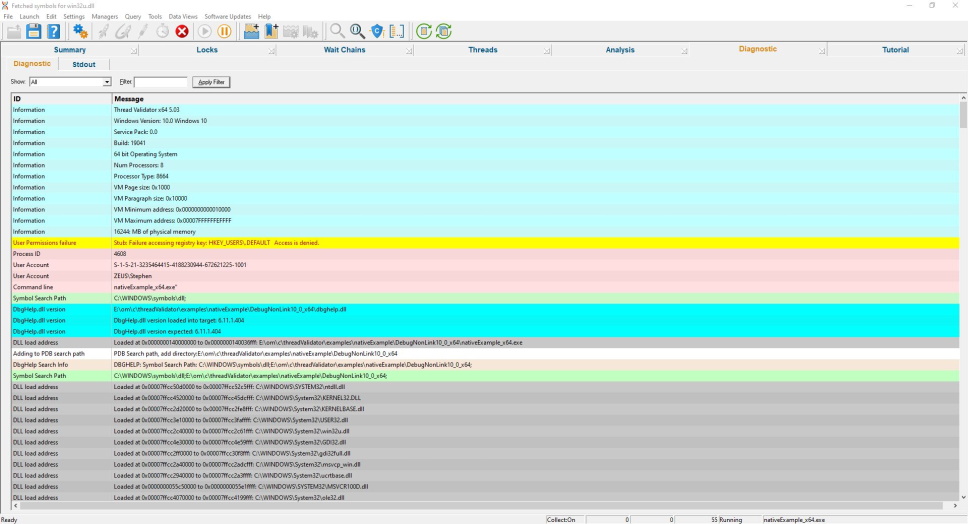
The diagnostic display informs you of any information that you need to know which may affect the performance of Thread Validator.
- DLL load address
- Symbol information search/load/success/failure
- Instrumentation success and failure
- Disassembly of troublesome code
- Misc diagnostic info
- Env vars
- Stdout/Stderr
Get to work in minutes
You don’t need to modify your application, recompile your software or relink your application.
Just launch your application from Thread Validator and start collecting thread and synchronization data immediately.
Thread Validator uses your software’s debug information to perform the instrumentation of your software. Supported debug formats are PDB, TDS, DWARF, STABS, and COFF. We can also use MAP files if line number information is present.
Working with a service or IIS/ISAPI?
You don’t need to modify your software unless you are writing a service or working with IIS.
If you’re working with a service or IIS there is a simple API you can use that you can “fit and forget”. It’s so easy to use you can leave the API linked into your release product – it will do nothing unless Thread Validator is present.
4 step deadlock detection
This simple 4-step process is how you detect threading errors with Thread Validator.
- Launch your application with Thread Validator.
- Run your application as normal.
- Close your application.
- Examine the profiling statistics that Thread Validator generates as your application runs.
Intuitive data displays show you the critical section for each thread as your application executes. You do not need to wait until your application has finished to view statistics for any function, file or DLL. The displays can be filtered to show you only the information that you want to work with.

Detailed, colour-coded displays show at-a-glance which critical sections are locked and which critical sections have high contention rates.

The lock order can also be inspected. Click on any item to see which other threads are also hold this lock or waiting on this lock.
Configurable
Thread Validator can be configured to collect all data or just the data you need. Powerful filters for collecting data and for displaying collected data give you maximum flexibility and control over how much CPU time is spent and how much memory is used collecting data allowing you to choose how much effort is put into a given task.
API
Thread Validator provides an API for using Thread Validator with services for the case when Thread Validator cannot inject into a service because of Windows NT security privileges preventing the injection (typically for services running at Administrator or system level).
Filtering
The default options of Thread Validator provide profiling data for all DLLs and files in your application that have debugging information. If you wish to only create profiling reports for selected DLLs, or exclude certain file types or even specific classes and methods, Thread Validator has filtering capabilities to allow such customisation.
Compatible
Thread Validator works with compilers from:
| Vendor | Language | Compiler / IDE |
|---|---|---|
| Microsoft | C++, C, Visual Basic 6 | Visual Studio |
| Intel | C++, C, Fortran | Intel Performance Compiler, Intel Fortran |
| Embarcadero | C++, C, Delphi | C++ Builder, Delphi, Rad Studio |
| MinGW | C++, C | g++ / gcc |
| Cygwin | C++, C | g++ / gcc |
| MSYS2 | C++, C | g++ / gcc |
| LLVM | C++, C | Clang |
| Qt | C++, C | QtCreator |
| Metrowerks | C++, C | Code Warrior |
| Salford Software | Fortran 95 | Fortran 95 |
We support many versions of Visual Studio: Visual Studio 2022, 2019, 2017, 2015, 2013, 2012, 2010, 2008, 2005, 2003, 2002 and Visual Studio 6 are supported.
All 64 bit (x64) Windows operating systems are supported.
All 32 bit Windows operating systems from Windows 11 to Windows XP are supported.
.Net and .Net Core
Thread Validator can’t instrument the .Net monitors in your application, but if you’re writing mixed mode applications Thread Validator can instrument the native parts of your mixed mode application.
Command line
Thread Validator also allows you to automate thread analysis by launching Thread Validator from the command line.
A full range of command line options allow you to perform unattended thread analysis with Thread Validator, complete with HTML export and XML export, to facilitate regression testing as part of your overnight builds.
Example 1 Launch an application, when the application completes save the results and refresh some displays.
threadValidator.exe -program "c:\myProgram.exe"
                    -saveSession "c:\myResults\session1.tvm"
                    -displayUI -refreshSummary -refreshLocks -refreshActiveObjects
Example 2 Launch an application, when the application completes save the results and export the results as HTML.
threadValidator.exe -program "c:\myProgram.exe"
                    -saveSession "c:\myResults\session1.tvm"
                    -exportAsHTML "c:\myResults\session1.html"
                    -hideUI
Thread Validator Feature List
- Detect deadlocks.
- Detect potential deadlocks.
- Detect bad lock strategy.
- Initialising a critical section more than once.
- Entering an uninitialised critical section.
- Leaving an uninitialised critical section.
- Leaving an unlocked critical section.
- Deleting a locked critical section.
- Deleting a deleted critical section.
- Abandoned critical section.
- Leaving locked critical sections in the wrong order.
- Busy locks.
- Slow locks.
- Contended locks.
- Recursing locks.
- Slow waits.
- Lock Order Display. Displays locks in the order acquired.
- Synchronization object search.
- Synchronization object query.
- Synchronization address query.
- Function query.
- Single thread critical section detector.
- Display stack traces for all threads, including deadlocked threads. This option uses proprietary stack walking algorithms to obtain stack traces that, if viewed in the debugger, would be very short.
- Command line execution.
- Support for regression testing.
- Data export (HTML, XML).
- Start by launching an application and monitoring that application (or a child process).
- Start by injecting into a running process.
- Start by waiting for a process to start and injecting into that process at startup.
- Link to API binary to gain access to the instrumentation API.
- Link to service API binary to use Thread Validator with your service/IIS.
- Instrumentation API to allow customised data collection for advanced users.
- Instrumentation is fast, a few seconds, not tens of minutes.
- Runs at nearly full speed of non-instrumented application, not 2 or 10 times slower.
- Instrumentation can be customized at the DLL level or down to the function level, as you require. Completely flexible as to which functions you choose to instrument.
- No need to rebuild or relink your application.
- Minimal compile and link to allow the use of instrumentation API.
- Minimal compile and link to use Thread Validator with NT services if you want to track the whole service.
Software Updates
We update our software tools on a regular basis – on average about 26 updates per year. Updates are optional, you only need to download the most recent update to be up-to-date.
You can set up automatic software updates using the credentials we supply to you when you purchase. Automatic software updates can be set up to check daily, weekly, monthly or never.
