Coverage Validator Tutorials

The Tutorials

Getting Started

Why is Coverage Testing Important?

Static Linking MFC and CRT

Dynamic Linking MFC and CRT

Code Coverage Sample Application #1

Code Coverage Sample Application #2

Getting code coverage for a .Net Core application

Getting code coverage for a .Net Core application child process

Code Coverage for a service

Code Coverage for a service child process

Collecting code coverage in an IIS ISAPI DLL

Code Coverage of ASP.Net with IIS

Collecting code coverage for ASP.Net with Web Development Server

Getting Code Coverage for a Dynamically Linked Library

Getting Code Coverage for a Statically Linked Library

Excluding Code Coverage for a Dynamically Linked Library

Excluding Code Coverage for a Statically Linked Library

Wizard Mode/Dialog Mode.

Interactive Profiling

Merging Samples

Command Line

Regression Testing

Identifying Unused Code
Code Coverage of ASP.Net with IIS
This tutorial describes how to collect code coverage in ASP.Net applications tested on IIS.
Related tutorials:
Code coverage for a .Net Core application.
Code coverage for a .Net Core application child process.
Code coverage for a service.
Code coverage for a service child process.
Code coverage for an IIS ISAPI DLL.
Code coverage for ASP.Net with IIS.
Code coverage for ASP.Net with Web Development Server.
Example Web Application
An example web application to use with this tutorial is in <Coverage Validator install directory>\examples\aspnetExample\aspnetExample\.
Load \examples\aspnetExample\aspnetExample\aspnetExample.csproj and build the configurations or build aspnetExample.csproj as part of the examples.sln solution.
Deploying the example web application for testing
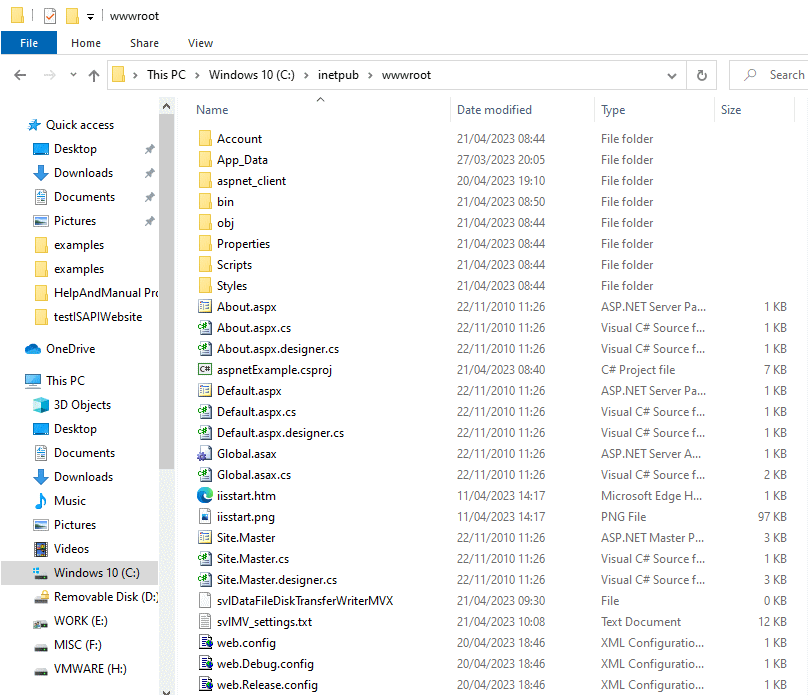
Once you have built the example application, copy the contents of <Coverage Validator install directory>\examples\aspnetExample\aspnetExample\ to the web root (for example c:\inetpub\wwwroot).
The resulting web root will look similar to this:

Collecting code coverage in ASP.Net on IIS
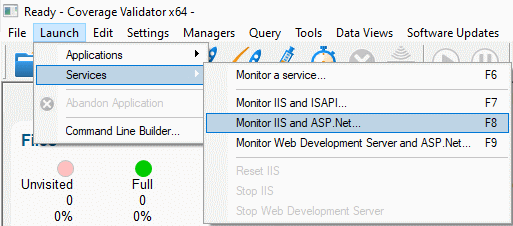
- Choose the Launch > Services > Monitor IIS and ASP.Net… option.

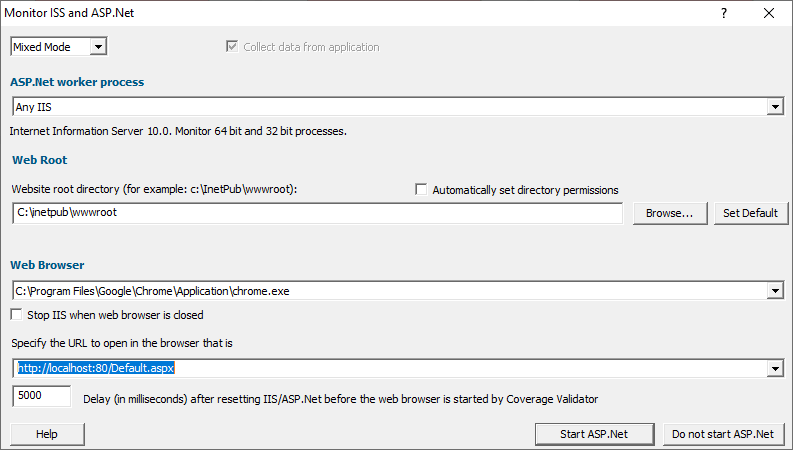
- The Monitor IIS and ASP.Net dialog is displayed.

- Choose the appropriate native/mixed-mode/.Net option to specify which types of code you want to collect code coverage for. Mixed-mode is the default, as this collects code coverage information for all types of code.
- Choose which ASP.Net worker process you are going to monitor. If you’re not sure just choose Any IIS.
- Specify the path to the IIS web root.
- Select a web browser of your choice. For this example, we’ll choose chrome.exe.
- Specify the URL that is going to be loaded from the web application. The default is http://localhost:80/Default.aspx
- When you click OK, Coverage Validator will set up everything needed to interact with the IIS, and the web browser will be started to load the specified URL.
- Coverage Validator will instrument your ASP.Net application and start collecting code coverage data.
The first time you start IIS, you may find that the web browser fails to open the web page because it takes longer to serve the page due to the code coverage monitoring. If this happens just wait a few seconds then reload the page in the web browser.
Stopping IIS
When you have finished testing your ASP.Net application you need to stop IIS so that all .Net operations can conclude.
If you had selected Stop IIS when web browser is closed on the Monitor IIS and ASP.Net dialog then you have nothing to do.
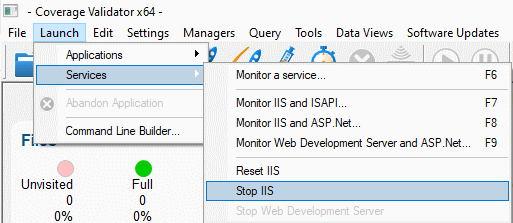
Otherwise, choose Launch > Services > Stop IIS

IIS will be requested to stop. This may take 30 seconds or more.
When IIS stops, Coverage Validator will finish collecting code coverage and prepare its final collect code coverage reports.
I’m not getting any code coverage data. What can I do?
There are a few things to check.
- Check the diagnostics tab. If the NT Service API is working correctly, Coverage Validator will have some data. Information on instrumentation failures will be on the diagnostic tab.
- Check the debug information dialog. You can access this from the Tools > DLL Debug Information… menu. This dialog will tell you which DLLs have debug information and which do not. Any DLLs that don’t have debug information you’ll need to ensure that debug information is built for these DLLs and is findable.
Conclusion
You have learned how to use Coverage Validator to monitor ASP.Net applications using the IIS, and what to look at to diagnose errors if things don’t work first time.