Coverage Validator Tutorials

The Tutorials

Getting Started

Why is Coverage Testing Important?

Static Linking MFC and CRT

Dynamic Linking MFC and CRT

Code Coverage Sample Application #1

Code Coverage Sample Application #2

Getting code coverage for a .Net Core application

Getting code coverage for a .Net Core application child process

Code Coverage for a service

Code Coverage for a service child process

Collecting code coverage in an IIS ISAPI DLL

Code Coverage of ASP.Net with IIS

Collecting code coverage for ASP.Net with Web Development Server

Getting Code Coverage for a Dynamically Linked Library

Getting Code Coverage for a Statically Linked Library

Excluding Code Coverage for a Dynamically Linked Library

Excluding Code Coverage for a Statically Linked Library

Wizard Mode/Dialog Mode.

Interactive Profiling

Merging Samples

Automatic Merging

Command Line

Regression Testing

Identifying Unused Code
Interactive Profiling
This tutorial demonstrates viewing code coverage of an application while the application is running, using Coverage Validator.
This technique lets you interactively test your software’s code coverage, viewing the results in real-time. Because you can see what is covered and what isn’t covered, you can update your testing strategy as you go, uncover bugs in your code during testing, and repeatedly test the same function with different inputs driven by your user interface.
This covers:
- The use of the Dialog Mode Launch Dialog
- Launching the sample application
- Inspection of coverage results whilst an application is running
- Choosing options within the test program to increase coverage results
- Closing the application and inspecting the coverage results
- Change the user interface mode to Dialog Mode. Select User Interface Mode… on the Settings menu.
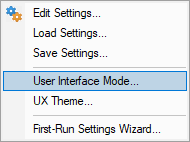
- The user interface mode dialog is displayed.
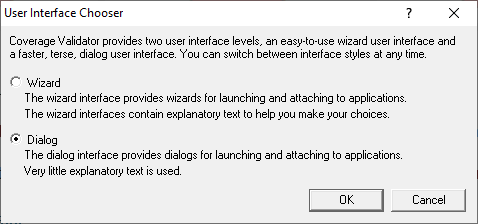
- Select the Dialog Mode radio box then click OK.
- Launch the sample application. Click on the launch icon on the toolbar. Alternatively, to relaunch the most recently launched application, click the launch icon with an orange loop around it.

- If the launch icon is selected the Launch application dialog is displayed.
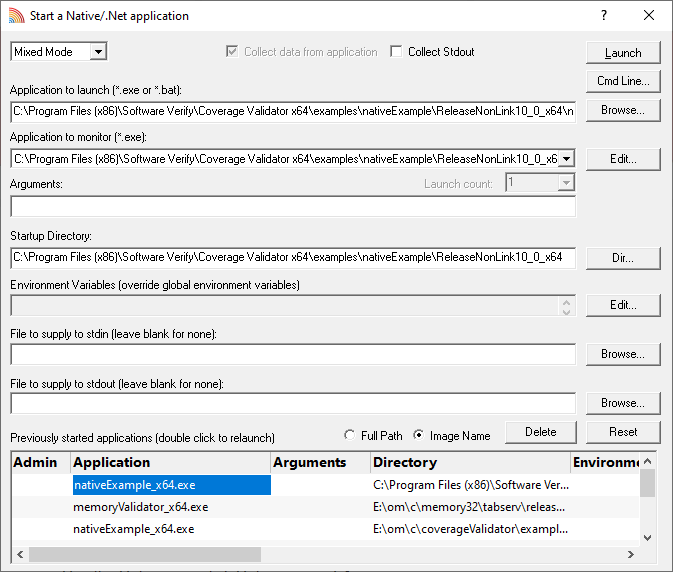
- Select the sample application nativeExample.exe (or nativeExample_x64.exe) using the Browse… button, or select a previously executed application from the list at the bottom of the dialog.
- Click the Launch button to launch the application.
- The nativeExample.exe application is started.
- If the relaunch icon is selected the most recently started application is started (for this tutorial we will assume this is nativeExample.exe).
- Whilst Coverage Validator is instrumenting the application progress information is displayed in the Coverage Validator title bar.
- The Summary display updates to show high level coverage statistics.
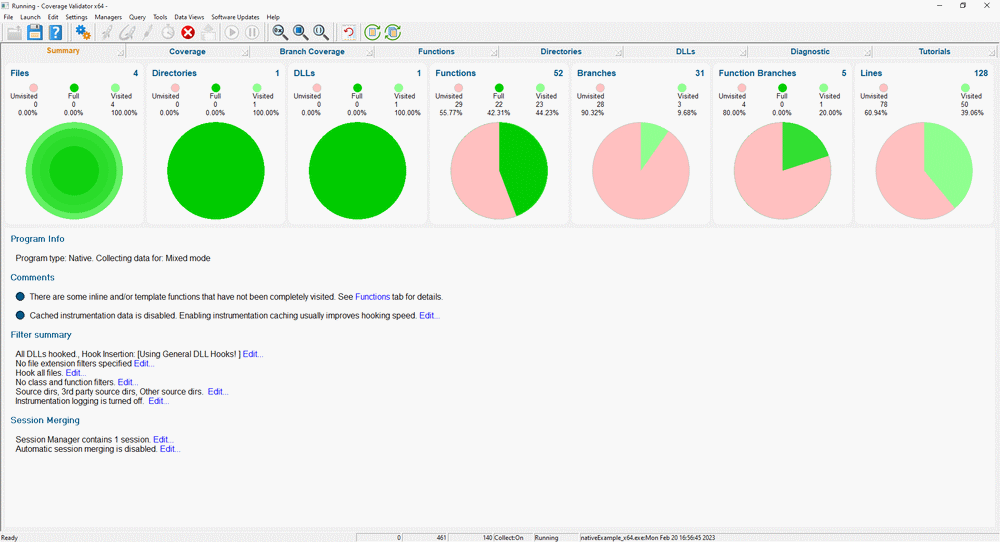
- The Coverage display updates to show the names of source code files and statistics about each file.
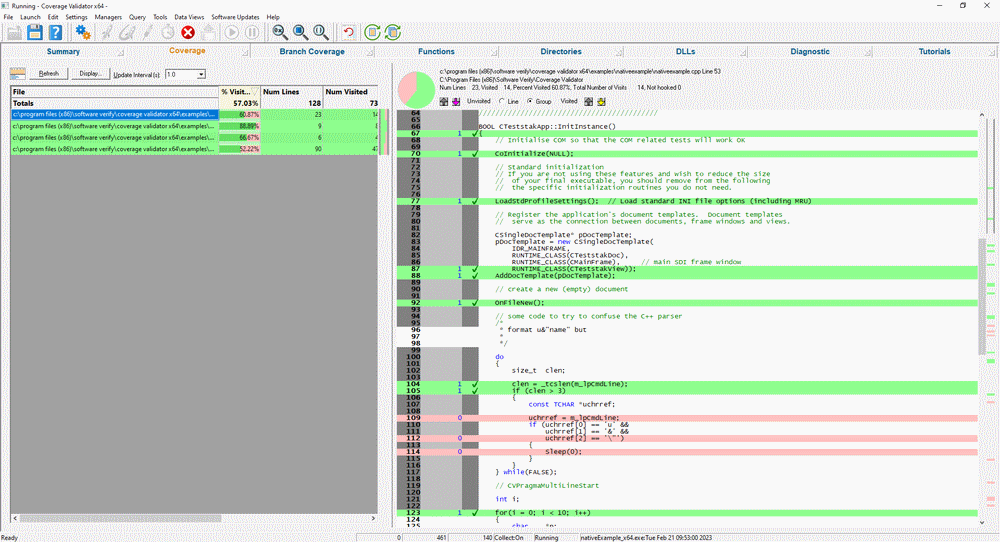
- Inspect the coverage results for testsvw.cpp.
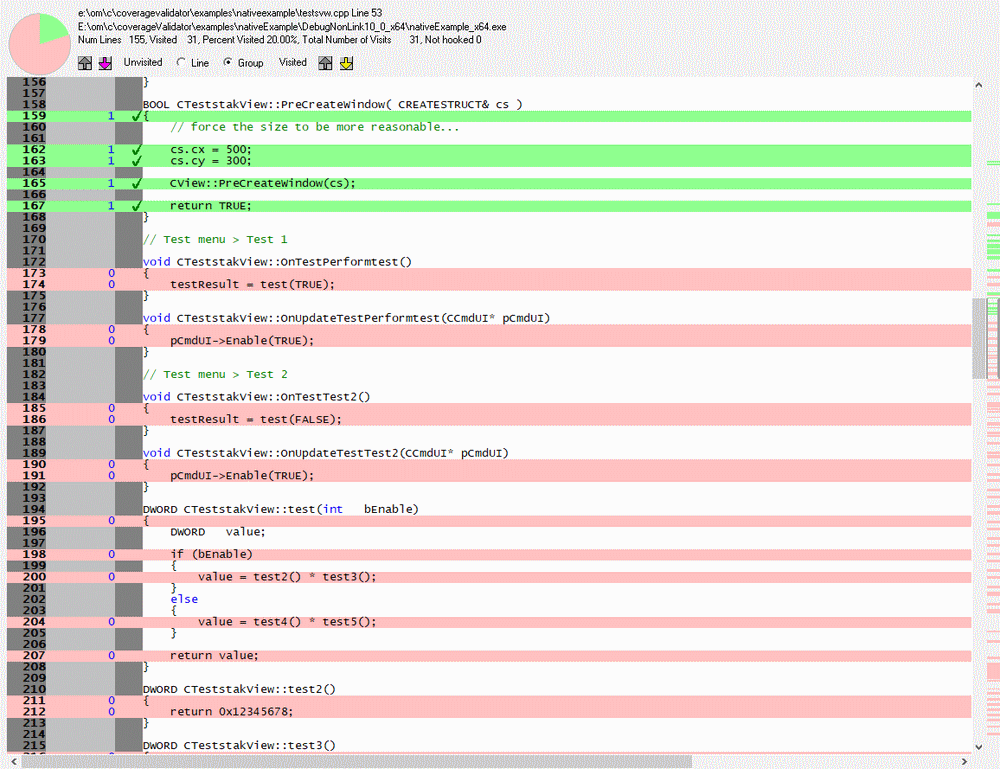
- Examining the coverage results in the source code viewer we can see that OnTestPerformTest(), OnTestTest2(), test(), test2(), test3(), test4() and test5() have not been tested. Click the Test menu entry for Test1.
- Inspect the coverage results for testsvw.cpp. Notice that the function relating to the menu entry Test1 now contains coverage results indicating the function has been visited. You may need to click the Refresh button on the display for force Coverage Validator to update the display before the display interval.
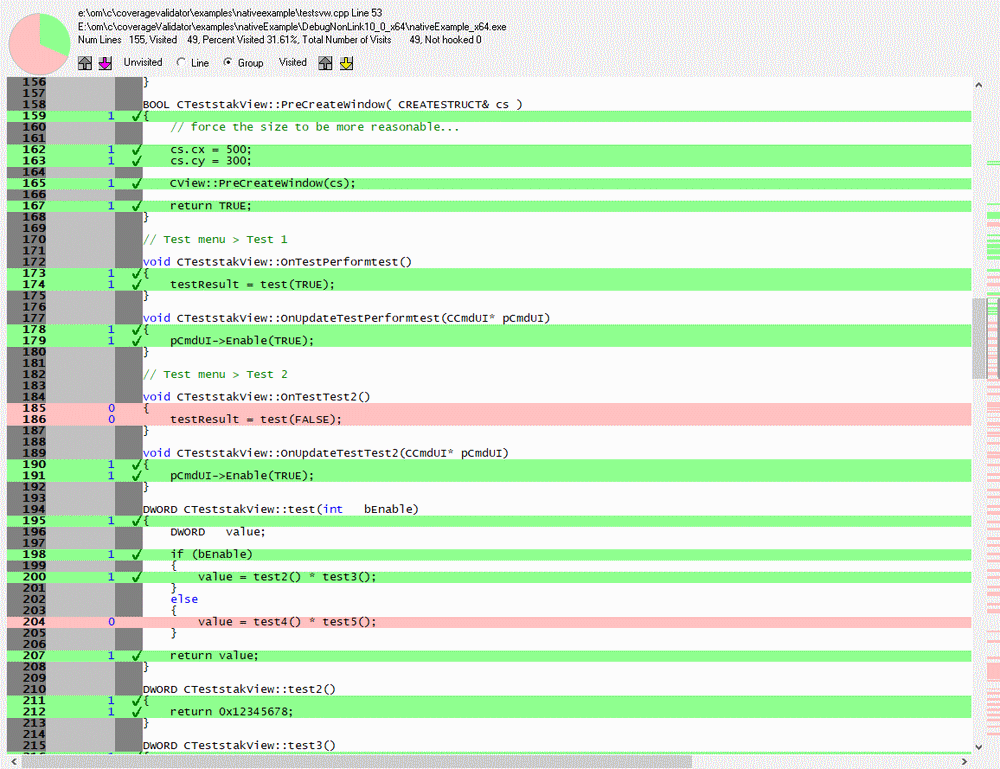
- Examining the coverage results in the source code viewer we can see that OnTestTest2(), test4() and test5() have not been tested. Click the Test menu entry for Test2.
- Inspect the coverage results for testsvw.cpp. Notice that the function relating to the menu entry Test2 now contains coverage results indicating the function has been visited. You may need to click the Refresh button on the display for force Coverage Validator to update the display before the display interval.
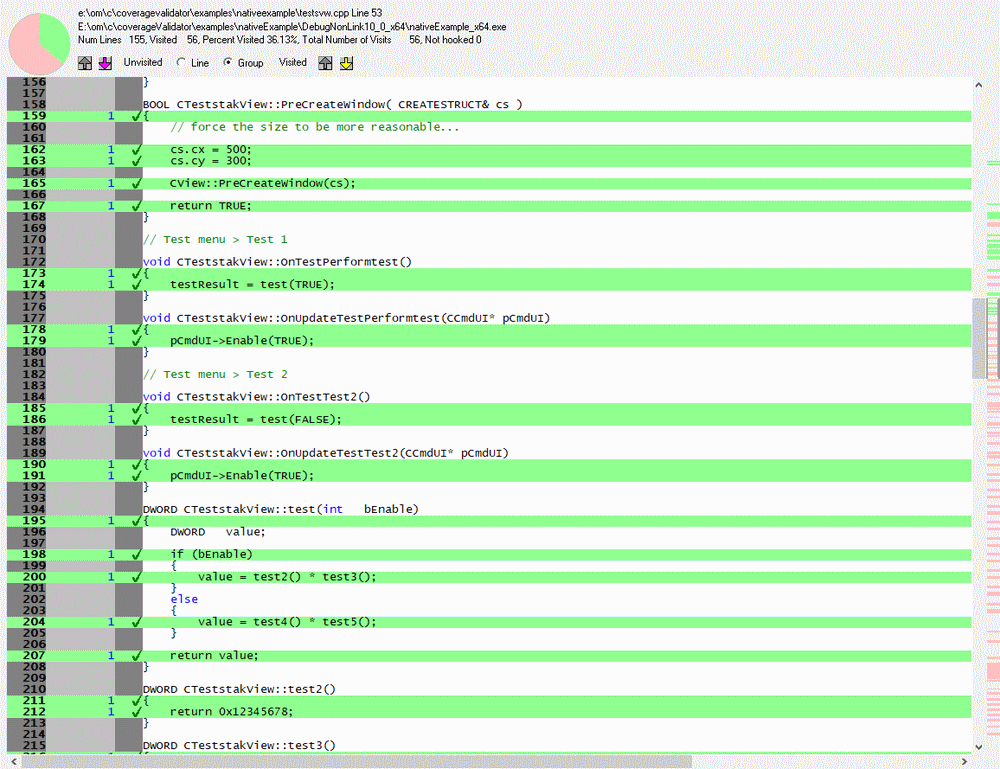
- Scroll down to CTeststakView::setColour() and inspect the method. The method is concerned with setting the background colour of the display according to an enumeration that is passed in. It’s a contrived method purely for the purpose of demonstrating real-time code coverage, whereas in production code, you’d probably have the colours in a lookup table.
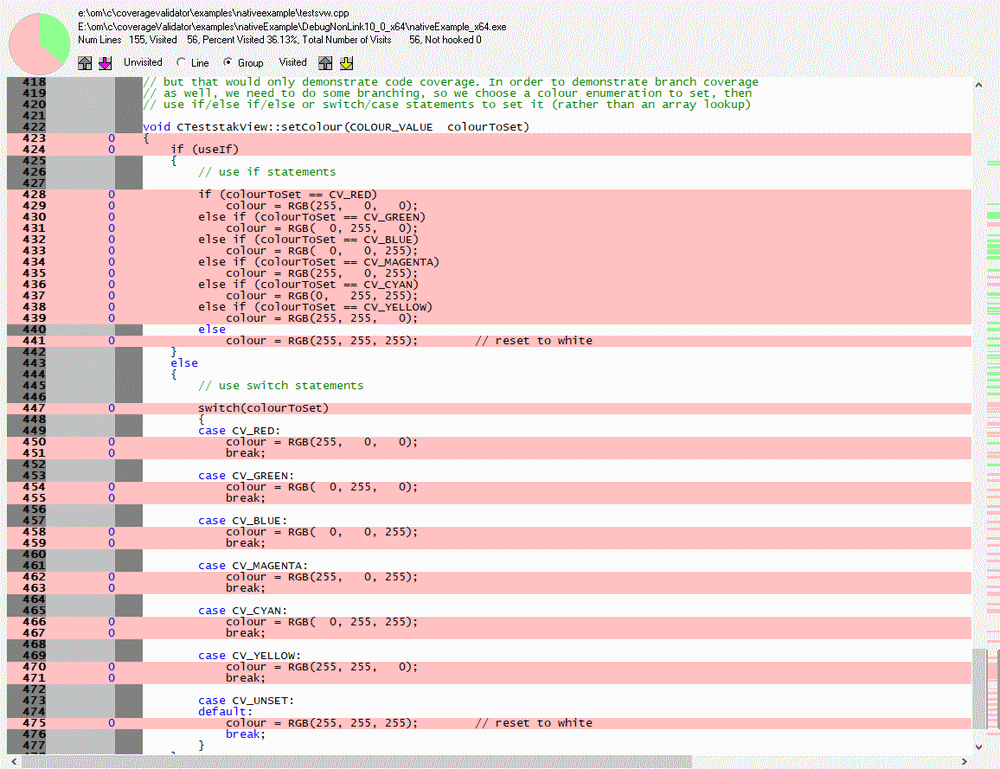
- Using the native example application on the colour menu, choose Green, Blue, and Cyan. Notice the coverage displays update in real-time.
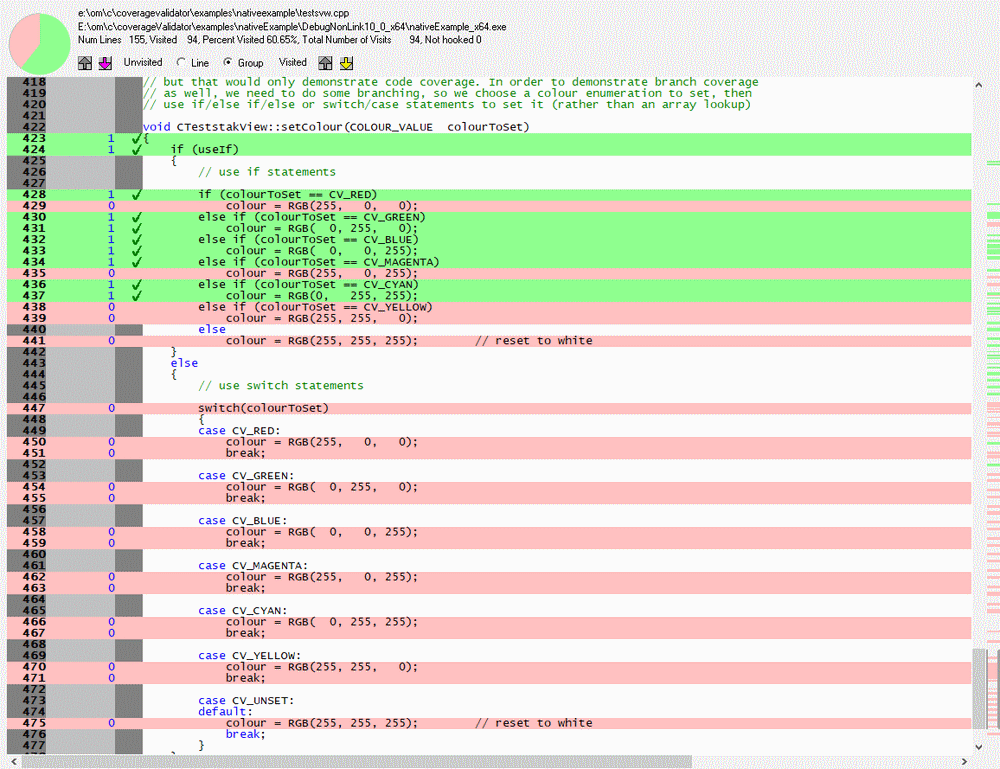
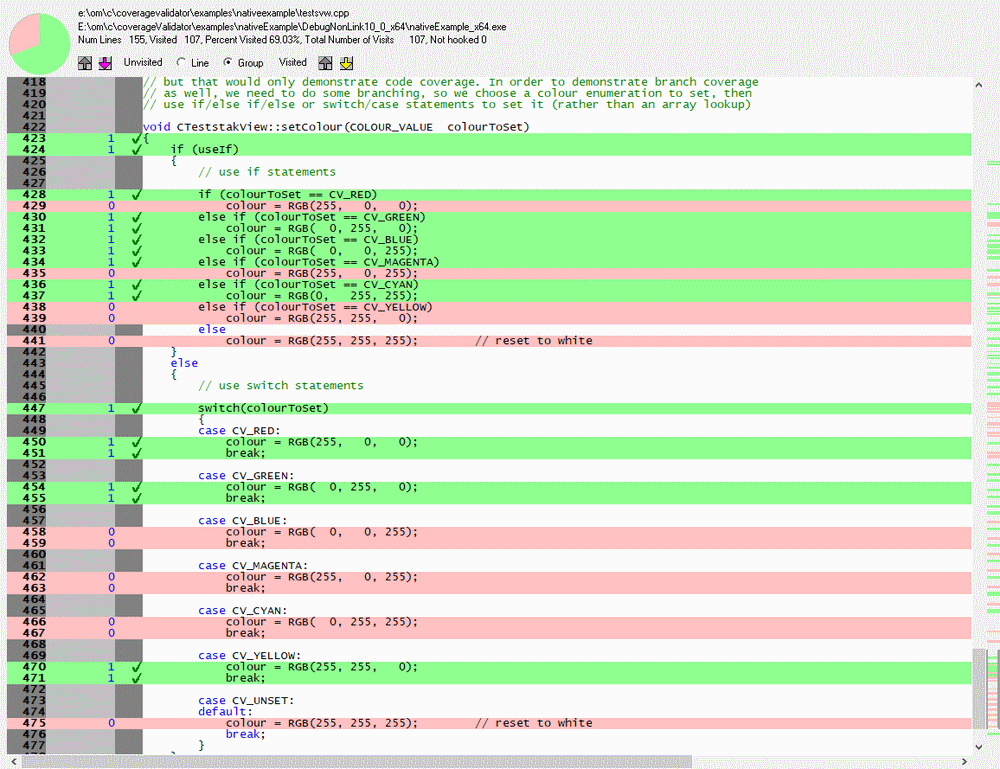
- On the colour menu choose Use Switch() Statments. Now choose Green, Red, and Yellow. Notice the coverage displays update in real-time.
- Inspect the coverage results for nativeExample.cpp.
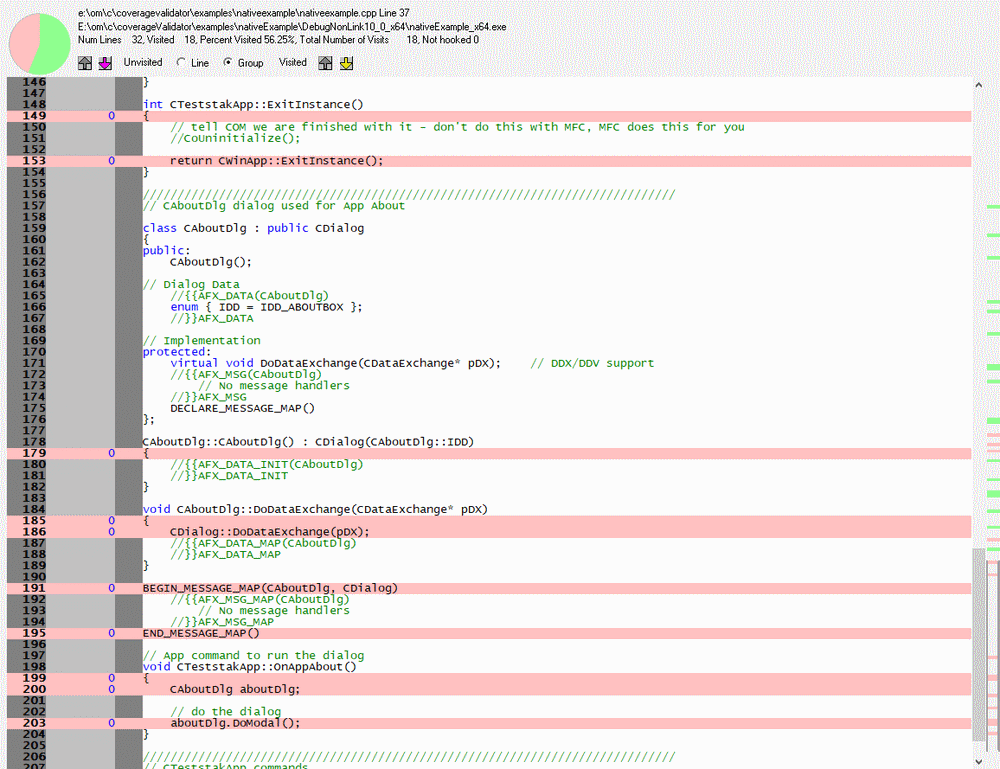
- We can see from the source code viewer for nativeExample.cpp that the “About Box” has not been tested. Click the Help menu entry Help About Coverage Validator Tester…. The “About Box” for nativeExample is displayed. Click OK to dismiss the dialog box.
- Inspect the coverage results for nativeExample.cpp. Notice that the CAboutDlg methods now contain coverage results indicating various methods of CAboutDlg have been visited. You may need to click the Refresh button on the display for force Coverage Validator to update the display before the display interval.
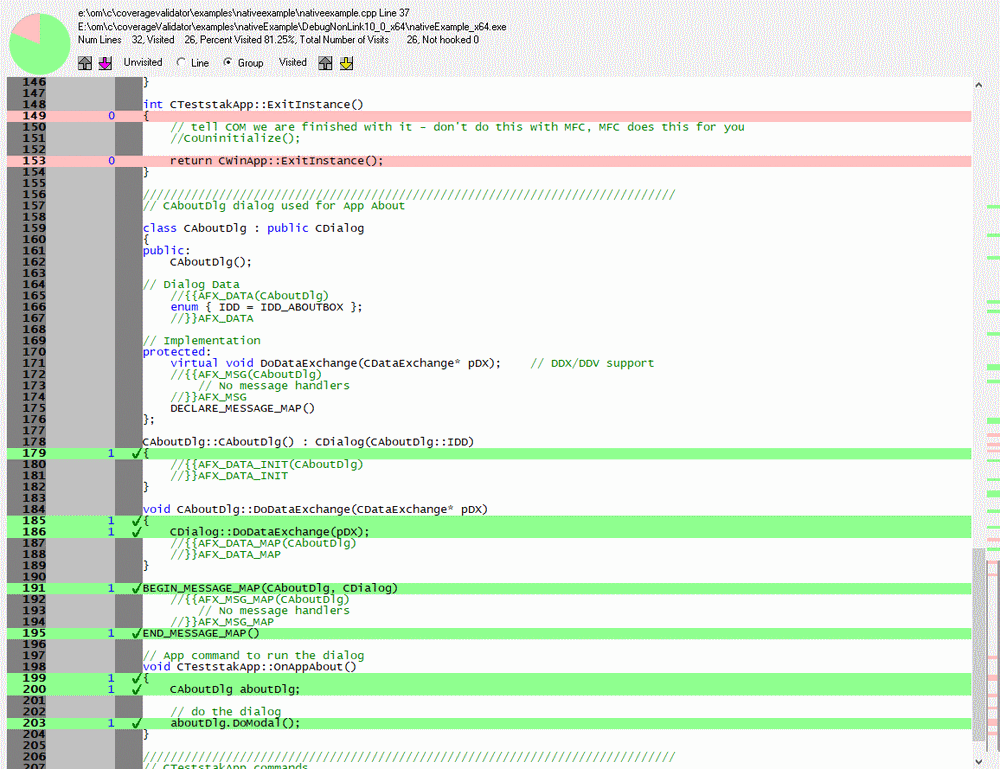
- Close nativeExample.exe using the File menu Exit command. The application closes. Coverage Validator processes any remaining data and displays the final code coverage results.
Conclusion
In this tutorial, you learned how the coverage displays updates in real-time, allowing you to inspect the code coverage of functions that are called in response to actions you make with the user interface. This allows you to interactively profile your software looking for bugs where you’d expect code to be executed, but it isn’t.