Memory Validator Tutorials

The Tutorials

How to detect memory leaks using Memory Validator

How to detect handle leaks using Memory Validator

How to detect memory leaks whilst your application is running

How to track memory allocations of a specific size using Memory Validator

How to monitor 3rd party memory allocation APIs using Memory Validator

How to view GDI objects using Memory Validator

How to detect COM Object Reference Count Errors using Memory Validator

Detecting memory leaks in a .Net Core application

Detecting memory leaks in a .Net Core application child process

Detecting memory leaks in a service

Detecting memory leaks in a service child process

Detecting memory leaks in an IIS ISAPI DLL

Detecting memory leaks in ASP.Net with IIS

Detecting memory leaks in ASP.Net with Web Development Server

Command Line Detecting Memory Leaks in a Child Process
Detecting memory leaks in a child process
This tutorial describes how to detect memory leaks in a child process of an application.
This tutorial covers the following:
-
- Using the launch dialog to specify the child process to monitor and the instance number of that child process.
- How to use the Memory Validator user interface to detect memory leaks in the child process.
Related tutorials:
Detecting memory leaks in a .Net Core application.
Detecting memory leaks in a .Net Core application child process.
Detecting memory leaks in a service.
Detecting memory leaks in a service child process.
Detecting memory leaks in an IIS ISAPI DLL.
Detecting memory leaks in ASP.Net with IIS.
Detecting memory leaks in ASP.Net with Web Development Server.
Native applications and mixed-mode applications
This tutorial applies to all native applications, .Net applications and to mixed-mode applications.
.Net Core Applications
If your application is written entirely in .Net Core, or your application is mixed-mode with the startup code written in .Net core you need to read a different tutorial, see the list of related tutorials above this.
Example Application and Child Process Application
Memory Validator ships with an example application and an example child process launched by the application. These can be found in the following directories in the Memory Validator installation directory:
- examples\nativeExample
- examples\serviceWithAChildProcess\childProcess
You need to build both of these projects. The easiest thing to do is to build the examples.sln.
Detecting memory leaks in the child process
Now that you have the example projects build, we can start collecting memory allocation data from the child process.
- Choose the Launch > Applications > Launch Application… option.
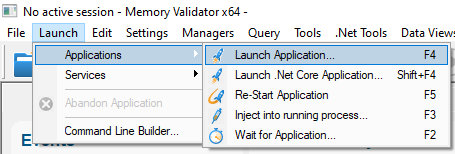
- The Launch dialog is displayed.
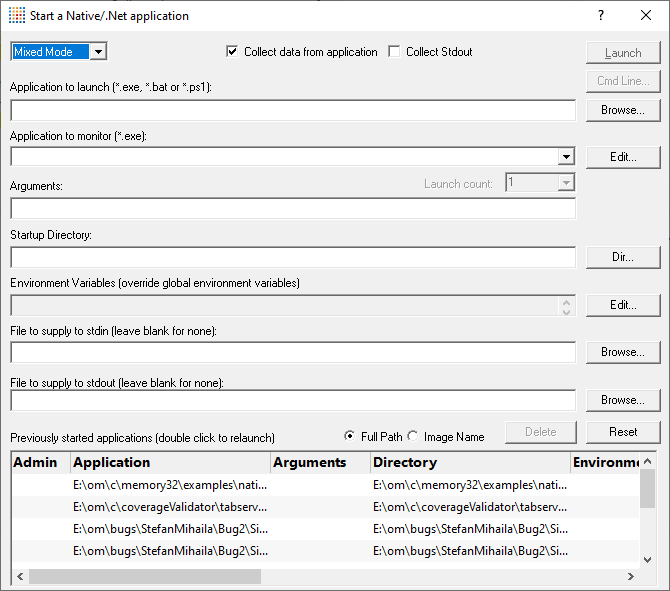
- Click Browse… next to Application to Launch and choose the executable that is going to launch the process you want to start checking for memory leaks. You can also choose a batch file or a powershell script. For this tutorial we’re going to start examples\nativeExample\Release10_0_x64\nativeExample_x64.exe.
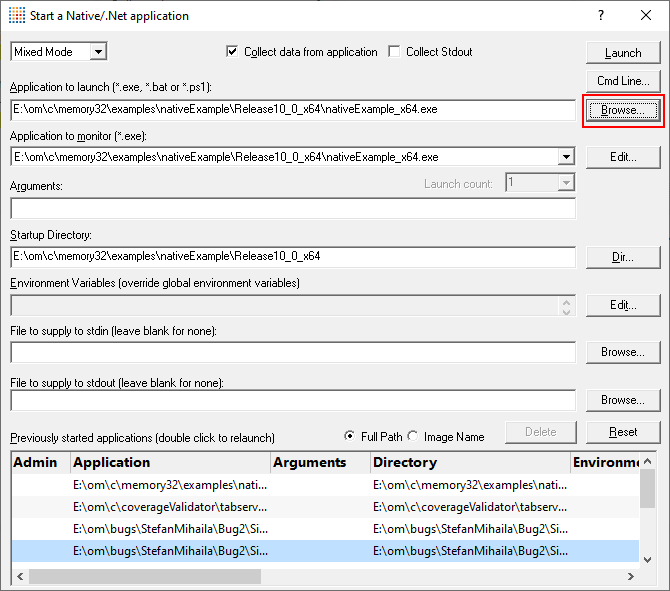
- Now we need to specify which child processes will be launched by the parent process. Click Edit… next to Application to Monitor.

The Applications to Monitor dialog will be displayed.
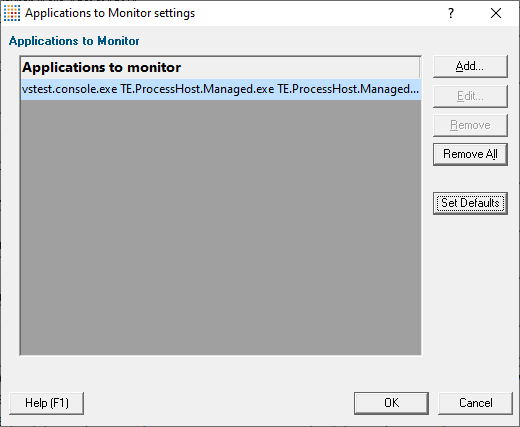
- We need to add an application definition. Click Add…. The Application to Monitor dialog will be displayed.
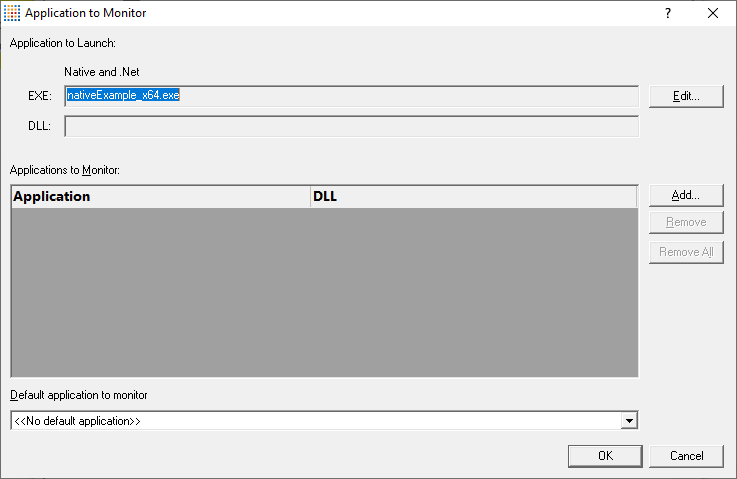
- To add an application click Add…. The Application and DLL dialog is displayed.
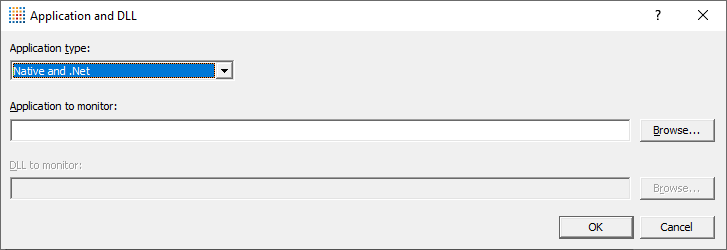
- Type the path to the child process executable or use the Browse… button to open a Microsoft file dialog to select the child process executable. For this tutorial we’re going to choose the child process executable: examples\nativeExample\Release10_0_x64\childProcess_x64.exe.
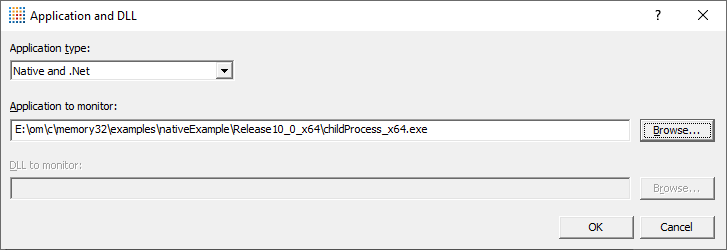
- Click OK to complete adding the child process definition. Repeat steps 6 and 7 to add as many child process definitions as you need for your process.
- When you have added all the child process definitions click OK to close the Application To Monitor dialog.
For this tutorial we’re only adding one child process definition, so click OK. - Click OK to close the Applications To Monitor dialog.
- If you examine the Application to Monitor field on the launch dialog you can see it now has some entries in addition to the name of the file we’re going to launch.

- Choose the child process in the Application to Monitor field.

- We’re going to monitor the first childProcess_x64.exe that is launched. This is the default, indicated by the 1 in the small combo below the Application to Monitor field. If you wanted to monitor the third childProcess_x64.exe that is launched you’d set this to 3.
- Now that we’ve specified the process to launch and the child process we can start the Application to Launch.
Click Launch….
Memory Validator starts the Application to Launch (in this tutorial that’s nativeExample_x64.exe). - When nativeExample_x64.exe is running choose the Child Process menu then choose Start ChildProcess….

The child process is started. In this tutorial that’s childProcess_x64.exe.
For childProcess_x64.exe you’ll see a cmd prompt open, there will be a pause while the application runs, then it will close. - Memory Validator will instrument your applications’s child process and start collecting memory allocation data.
- Memory allocation data will be collected until the child process finishes executing. For best results, we recommend closing the child process normally (do not kill it with TaskManager or TerminateProcess).
- You can close the parent process whenever you want – Memory Validator is not tracking it.
- When the child process finishes executing Memory Validator will display the leak results.

How Do I Repeat This?
There are three method of repeating this.
- To repeat launching the parent process and monitoring the child process just click the relaunch button on the toolbar.

- You can open the launch dialog then double click on an entry in the list at the bottom of the dialog.
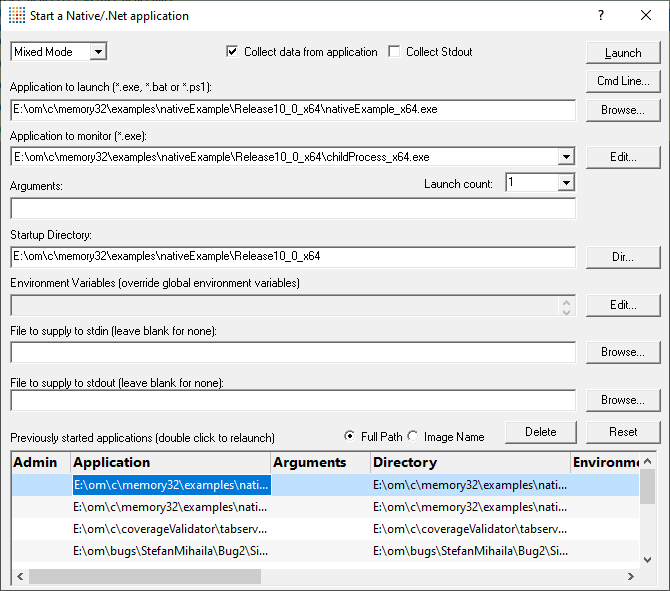
- You can open the launch dialog then select an entry in the list at the bottom of the dialog, edit any settings on the dialog, then click Launch.
I need to detect memory leaks in a grand child process or other descendant. How do I do that?
I’m not getting any memory allocation data. What can I do?
There are a few things to check.
- Data Collection
Have you got data collection turned off?
There is a Collect data from application check box on the launch dialog.
There are also data collection on/off buttons on the main toolbar, and Start collecting data and Stop collecting data options on the File menu. - Diagnostics
Check the diagnostics tab. If the injection and data transport is working correctly Memory Validator will have some data. Information on instrumentation failures will be on the diagnostic tab. - Debug Information
Check the debug information dialog. You can access this from the Tools > DLL Debug Information… menu. This dialog will tell you which DLLs have debug information and which do not. Any DLLs that don’t have debug information you’ll need to ensure that debug information is built for these DLLs and is findable.
Conclusion
You have learned how to launch an application and monitor a child process launched by that application, how to use Memory Validator to monitor the application’s child process, and what to look at to diagnose errors if things don’t work first time.