Memory Validator Tutorials

The Tutorials

How to detect memory leaks using Memory Validator

How to detect handle leaks using Memory Validator

How to detect memory leaks whilst your application is running

How to track memory allocations of a specific size using Memory Validator

How to monitor 3rd party memory allocation APIs using Memory Validator

How to view GDI objects using Memory Validator

How to detect COM Object Reference Count Errors using Memory Validator

Detecting memory leaks in a child process

Detecting memory leaks in a .Net Core application

Detecting memory leaks in a .Net Core application child process

Detecting memory leaks in a service

Detecting memory leaks in a service child process

Detecting memory leaks in an IIS ISAPI DLL

Detecting memory leaks in ASP.Net with IIS

Detecting memory leaks in ASP.Net with Web Development Server

Command Line Detecting Memory Leaks in a Child Process
Detecting memory leaks in ASP.Net with Web Development Server
This tutorial describes how to detect memory leaks in ASP.Net applications tested on Microsoft’s Web Development server.
Related tutorials:
Detecting memory leaks in a service.
Detecting memory leaks in an application that is a child process of a service.
Detecting memory leaks in an IIS ISAPI DLL.
Detecting memory leaks in ASP.Net with IIS.
Detecting detect memory leaks for a child process.
Example Web Application
An example web application to use with this tutorial is in <Memory Validator install directory>\examples\wdsAspnetExample\wdsAspnetExample\.
Load \examples\wdsAspnetExample\wdsAspnetExample\wdsAspnetExample.csproj and build the configurations or build wdsAspnetExample.csproj as part of the examples.sln solution.
Detecting memory leaks in the ASP.Net web application
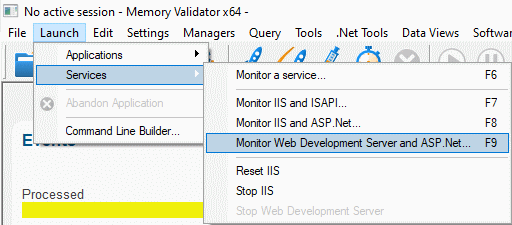
- Choose the Launch > Services > Monitor Web Development Server and ASP.Net… option.

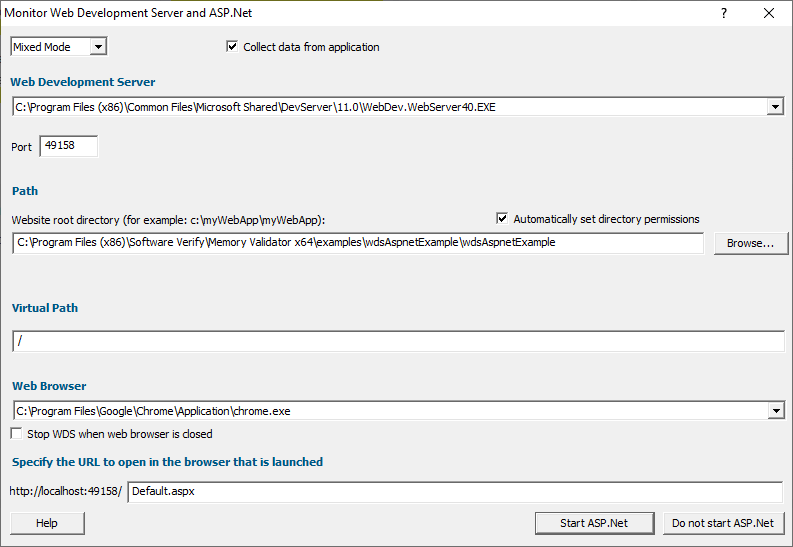
- The Monitor Web Development Server and ASP.Net dialog is displayed.

- Select the web development server you wish to use, and the port number. The defaults are chosen to represent the most recent version installed on your machine.
- Choose the appropriate native/mixed-mode/.Net option to specify which types of code you want to detect memory leaks for. Mixed-mode is the default, as this collects memory allocation information for all types of code.
- Select the path to the folder containing web application.
- Specify the virtual path that this folder represents. The default is the root of the website: /
- Select a web browser of your choice. For this example we’ll choose firefox.exe.
- Specify the URL that is going to be loaded from the web application. The default is Default.aspx
- When you click OK, Memory Validator will set up everything needed to interact with the Web Development server, the web browser will be started to load the specified URL.
- Memory Validator will instrument your ASP.Net application and start collecting memory allocation data.
The first time you start the web development server you may find that the web browser fails to open the web page because it takes longer to serve the page due to the memory allocation monitoring. If this happens just wait a few seconds then reload the page in the web browser.
Stopping Web Development Server
When you have finished testing your ASP.Net application you need to stop Web Development Server so that all .Net operations can conclude.
If you had selected Stop WDS when web browser is closed on the Monitor Web Development Server and ASP.Net dialog then you have nothing to do.
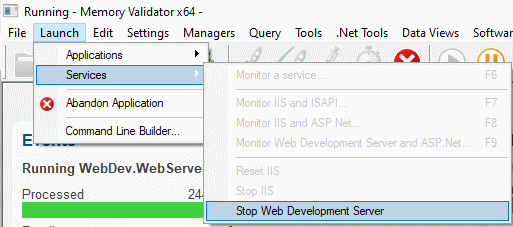
Otherwise, choose Launch > Services > Stop Web Development Server

Web Development Server will be requested to stop. This may take 30 seconds or more.
When Web Development Server stops, Memory Validator will finish monitoring memory allocations and prepare its final memory leak reports.
I’m not getting any memory allocation data. What can I do?
There are a few things to check.
- Check the diagnostics tab. If the NT Service API is working correctly, Memory Validator will have some data. Information on instrumentation failures will be on the diagnostic tab.
- Check the debug information dialog. You can access this from the Tools > DLL Debug Information… menu. This dialog will tell you which DLLs have debug information and which do not. Any DLLs that don’t have debug information you’ll need to ensure that debug information is built for these DLLs and is findable.
Conclusion
You have learned how to use Memory Validator to monitor ASP.Net applications using the Web Development server, and what to look at to diagnose errors if things don’t work first time.