Memory Validator Tutorials

The Tutorials

How to detect memory leaks using Memory Validator

How to detect handle leaks using Memory Validator

How to detect memory leaks whilst your application is running

How to track memory allocations of a specific size using Memory Validator

How to monitor 3rd party memory allocation APIs using Memory Validator

How to view GDI objects using Memory Validator

How to detect COM Object Reference Count Errors using Memory Validator

Command Line Detecting Memory Leaks in a Child Process

Detecting memory leaks in a .Net Core application

Detecting memory leaks in a .Net Core application child process

Detecting memory leaks in a service

Detecting memory leaks in a service child process

Detecting memory leaks in an IIS ISAPI DLL

Detecting memory leaks in ASP.Net with IIS

Detecting memory leaks in ASP.Net with Web Development Server
How to detect Memory Leaks
Memory Validator’s default settings will detect CRT memory leaks if your application and its DLL are linked to the dynamic CRT (MSVCRT.DLL or MSVCRTD.DLL or similar) and also if you are linked statically to the CRT. Note that you may get a bit more “noise” if you link statically.
Default Settings
If you have changed the settings of Memory Validator, please ensure that you have enabled the collection of CRT memory leaks, and enabled the display of CRT memory leaks. You can do this using the data settings dialog.

Alternatively, pressing the Reset button on this dialog will select the default settings.
Sample Application
This tutorial will use the nativeExample.exe sample application to demonstrate memory leak detection. The nativeExample.exe application is shipped as a project with source code. The project can be found in the nativeExample directory in the same directory that Memory Validator was installed in. Please compile all configurations of the sample application before continuing the tutorial. The project file is nativeExample.dsp.
Windows 2000 and Windows XP
If you are building the sample application for use with Windows 2000 or Windows XP, you will need to define _WIN32_WINNT=0x0500 and WINVER=0x0500.
You will also need to add the following libraries to the list of libraries to link to (shlwapi.lib, crypt32.lib, mscms.lib).
Visual Studio 7.0 and better
When compiling with Visual Studio 7.0 and above you will find that line 840 of testsvw.cpp will not compile. This line is present for Visual Studio 6.0 users to test the broken message map detection functionality. Visual Studio 7.0 and above will not compile this line as it will result in incorrect program behaviour. As a result this line is conditionally compiled and is only included for Visual Studio 6.0 and below.
ON_COMMAND(ID_MEMORYERRORS_MESSAGEMAPERROR, OnMemoryerrorsMessagemaperror)
Visual Studio Express
When using Visual Studio Express you may find that the example application will not build because Visual Studio Express does not ship the appropriate libraries. If that is the case you can still read the tutorial to learn about Memory Validator but you will not be able to use the example application. Memory Validator will be able to detect memory leaks and memory errors in applications you create with Visual Studio Express.
Selecting the dynamic CRT
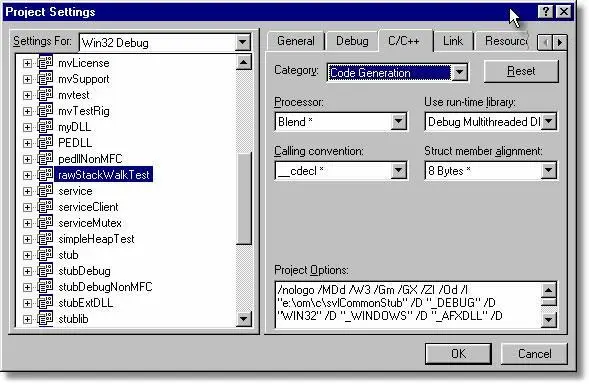
To select the dynamic CRT for your projects, open the Project Settings Dialog, choose the C++ tab, category code generation, and select Debug Multithreaded DLL or Multithreaded DLL as appropriate.

Detecting Memory Leaks
To detect memory leaks in the dynamic C runtime:
- Start your program using Memory Validator’s launch program option.
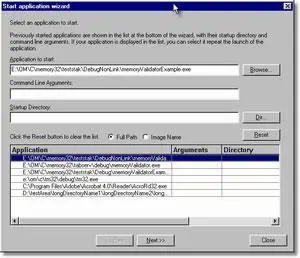
 The launch application wizard displayed.
 Select [installdir]\nativeExample\debugNonLink\nativeExample.exe using the Browse… button. Accept all default settings and move through all pages of the wizard to the last page. Click the Start Application button.
 - Use your program as normal. For the purposes of this tutorial, nativeExample.exe has some defects and has already leaked some memory. You can also generate more memory and handle leaks by using the many menu options.
- To improve the execution speed of the application being monitored, Memory Validator puts all collected data onto a queue to send to the Memory Validator user interface. This means the application being monitored does not have to wait for inter-process communications delays. When the Memory Validator user interface receives the data it is also put on a queue to be processed so that the user interface also does not have to wait for inter-process communications delays.As your program executes, Memory Validator monitors the allocations and deallocations you selected using the data collection settings dialog. The data collected is sent to the Memory Validator user interface. Memory Validator displays an indication of how much data is sent the status bar, at the bottom left of the Memory Validator user interface.

- The Collect:On indicates that data is being collected and sent.
- The left hand number indicates the number of data items that Memory Validator has not yet processed. This is an indication of the amount of data in the Memory Validator user interface queue.
- The middle number indicates the number of data items that Memory Validator has processed.
- The right hand number indicates the number of memory allocations, handle allocations that have not been deallocated.
- Close your program as normal. For the purposes of this tutorial, choose File, Exit on nativeExample.exe.
- Memory Validator collects information during the application shutdown, as well as data about pointers in static memory. This data is sent to the Memory Validator user interface. The Memory Validator user interface processes all this data (you can monitor this progress on the status bar). When all the data has been processed, Memory Validator then analyses all memory allocations and deallocations that occurred during the lifetime of the program.
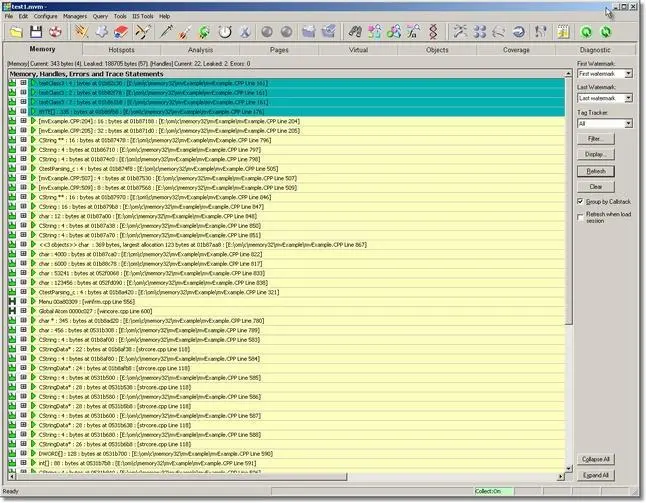
- All leaked memory is displayed on the Memory Tab in the colour assigned for memory leaks. The default colour for memory leaks is yellow. You will notice that in the display there are some memory allocations shown in teal. These are memory locations which are identified as leaked, but which also had pointers to the memory found in the static data areas (non-heap memory and non-stack memory) of the application when the application entered ExitProcess().
