Memory Validator Tutorials
Investigating behaviour between two points of execution
This tutorial describes how to use watermarks to examine memory allocations between two points in your application’s execution.
This tutorial will cover:
- preamble to setup each of the following watermark examples
- adding watermarks manually, via the user interface
- displaying memory allocations between watermarks
- adding watermarks programatically, via the API
This tutorial is for a native application, but the techniques demonstrated in this tutorial apply to all applications, services and IIS regardless of the technology used to create them.
Example Application
Memory Validator ships with an example application. These can be found in the following directories in the Memory Validator installation directory:
- examples\nativeExample
You need to build this project. The easiest thing to do is to build the examples.sln.
Investigating allocations between two watermarks
Now that you have the example project built, we can start collecting memory allocation data from the example project.
We’re going to show several techniques in this tutorial – we’ll break the tutorial into sections.
Preamble
With the preamble we’re going to setup the conditions for the following sections in the tutorial.
- Choose the Launch > Applications > Launch Application… option.
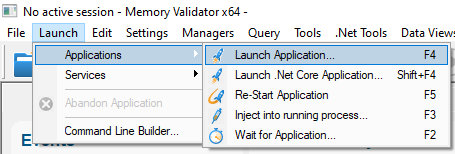
- The Launch dialog is displayed.
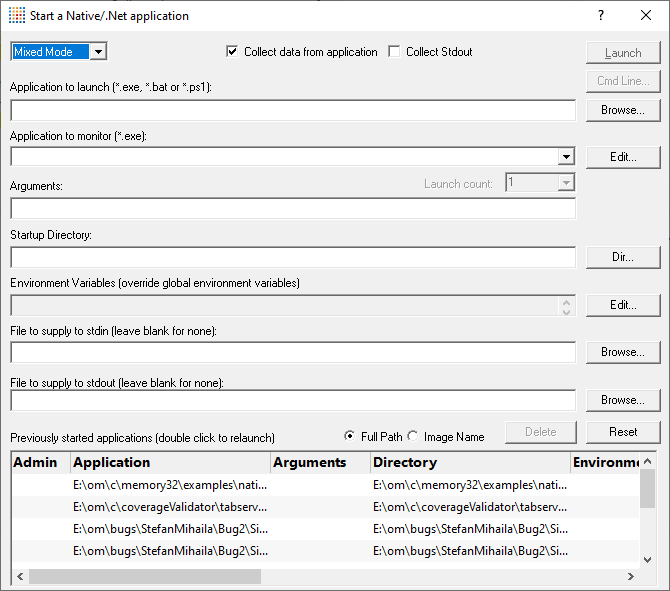
-
Click Browse… next to Application to Launch and choose the executable that is going to launch the process you want to start checking for memory leaks.
You can also choose a batch file or a powershell script.
For this tutorial we’re going to start examples\nativeExample\Release10_0_x64\nativeExample_x64.exe.
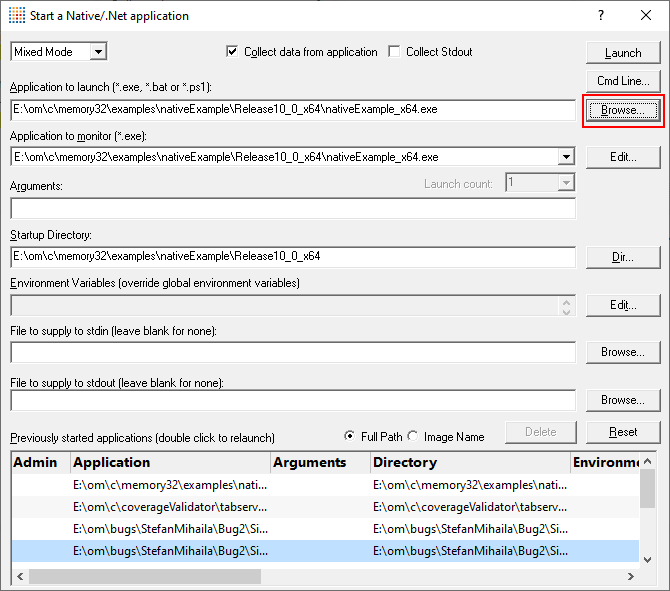
- Click Launch… to start the example project.
- The native example executable starts

- From the Allocation menu, choose Watermarks tutorial….
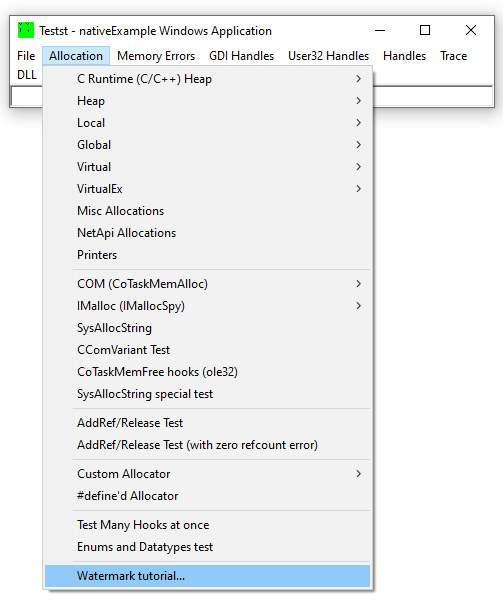
- The watermarks dialog is displayed.
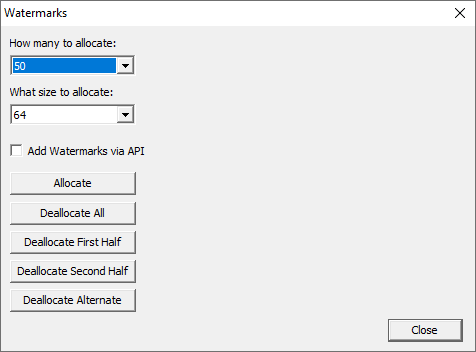
We’re going to use this dialog for the rest of the tutorial. - First, configure how many allocations to make, and what size each allocation should be. For this tutorial set How many to 500,000 and What size to 4,096.
Memory allocated across a transaction
In this section we’re going to show you how to examine memory allocations that happen across a transaction – something where you’d expect all allocations to have been deallocated (or most allocations to have been deallocated, leaving just the intended created objects and no temporary allocations).
We assume that you have completed the Preamble above and have the Watermarks dialog open in native example.
-
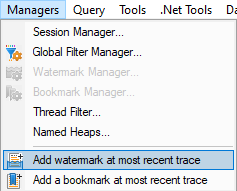
Using the Memory Validator user interface, click the Add Watermark icon on the toolbar, or Add Watermark… on the Managers menu.

-
The Watermark Name dialog is displayed.
The suggested name for the watermark is created based on the the name of the function at the top of the stack of the current stack trace.

Edit the name to something appropriate then click OK.
For this tutorial, edit the name to “start”, then click OK.
- Using the Watermarks dialog on native example, click Allocate.
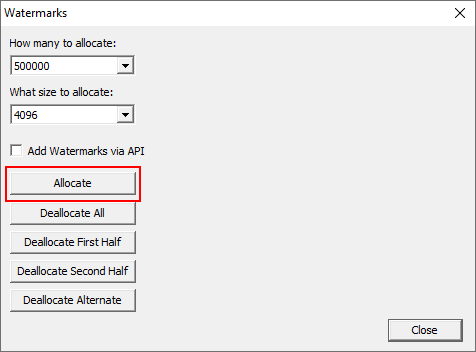
- You can see Memory Validator monitoring the memory allocations as native example allocates the memory.
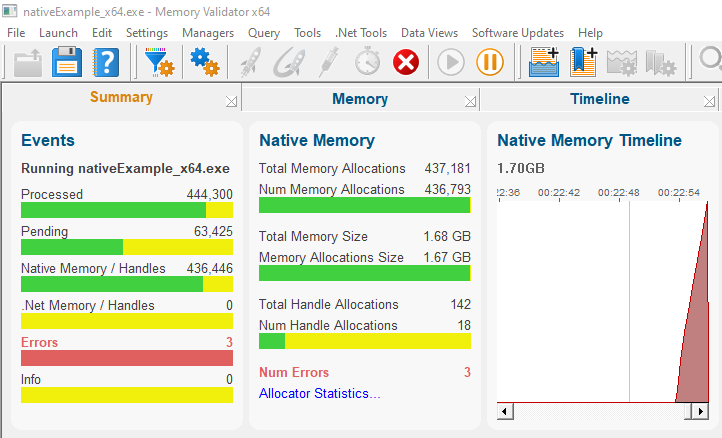
- Wait until the memory allocations have been processed by Memory Validator, then add another watermark and name it “middle”.
- Using the Watermarks dialog on native example, click Deallocate All.
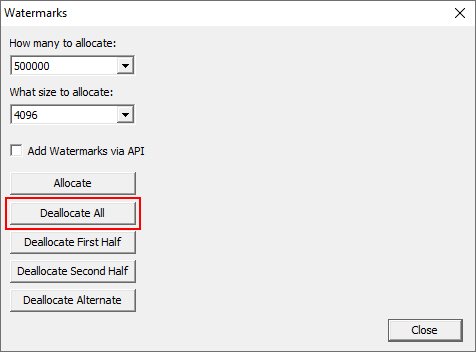
- You can see Memory Validator monitoring the memory deallocations as native example deallocates the memory.
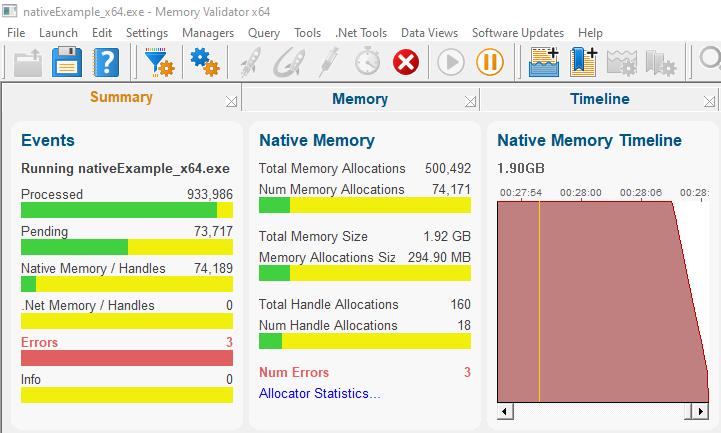
- Wait until the memory deallocations have been processed by Memory Validator, then add another watermark and name it “end”.
-
In a real application “start”, “middle” and “end” could have been wrapped around a database transaction, or the creation of an object in a CAD program.
For some testing purposes, and for some bug investigations it would be very useful to know what happened between “start” and “middle”, or “start” and “end”.
Let’s find out!
- Go to the Memory tab on Memory Validator’s user interface.

You may notice some errors displayed in red. This is OK – these errors are part of the example application and will be displayed with Memory Validator’s default settings. For this tutorial we can ignore these error messages. -
If you look to the left of the errors you will see two controls for Watermarks.
There are always two default watermarks: the First watermark and the Last watermark. These represent the start of the collected data and the end of the collected data. All watermarks created manually or via the API will fall between the First Watermark and the Last watermark.
- Change the First Watermark combo to “start”.
- Change the Last Watermark combo to “end”.
- Click Refresh.
- The display updates to show the memory allocated between “start” and “end” which has not been deallocated.

The display sort order is descending, so most recent allocations are at the top. We can see two watermarks, “end” and “middle”, a memory allocation in green that is to do with std::vector (owned by the Watermarks dialog) and a Critical Section (owned by Windows, created inside BeginWaitCursor(), it will be cleaned up during application shutdown) and finally the watermark “start”.The memory allocation in green indicates that Memory Validator has seen other memory allocations allocated with an identical callstack and those allocations have been deallocated. This isn’t a guarantee that this location doesn’t leak memory, but it’s a hint that this location may not leak memory.
So where are the 500,000 allocations? They aren’t displayed between the watermarks because they no longer exist – they were deallocated.
Inspecting memory allocations during a transaction
In this section we’re going to show you how to examine memory allocations part way through a transaction, before the objects get deallocated.
We assume that you have completed the Preamble above and have the Watermarks dialog open in native example.
You can continue on from the previous tutorial without restarting.
- Using the Memory Validator user interface, add a watermark named “before”.
- Using the Watermarks dialog on native example, click Allocate.
- You can see Memory Validator monitoring the memory allocations as native example allocates the memory.
- Wait until the memory allocations have been processed by Memory Validator, then add another watermark and name it “after”.
- Let’s investigate the allocations between “before” and “after”.
- Go to the Memory tab on Memory Validator’s user interface.
- Change the First Watermark combo to “before”.
- Change the Last Watermark combo to “after”.
- Click Refresh.
-
The display updates to show the memory allocated between “before” and “after” which has not been deallocated.

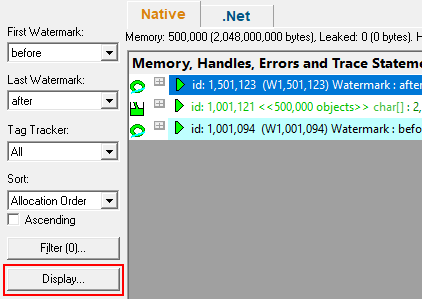
The display sort order is descending, so most recent allocations are at the top. We can see watermark “after”, a memory allocation in green that represents 500,000 memory allocations that have an identical callstack, and the watermark “before”.
The memory allocation in green indicates that Memory Validator has seen other memory allocations allocated with an identical callstack and those allocations have been deallocated. This isn’t a guarantee that this location doesn’t leak memory, but it’s a hint that this location may not leak memory.
The 500,000 memory allocations are displayed between the two watermarks, but occupy just one entry in the list because of Memory Validator’s display settings are set to “Simplified”.
- To display all memory allocations between the watermarks you need to modify the display settings. Click Display….
- The Memory Tab Display Settings dialog is displayed.
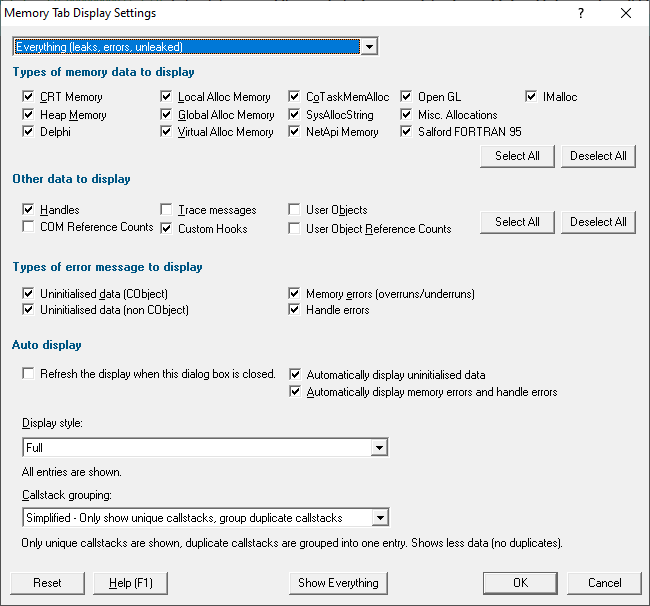
- Change the Callstack grouping combo to Full – show every callstack.
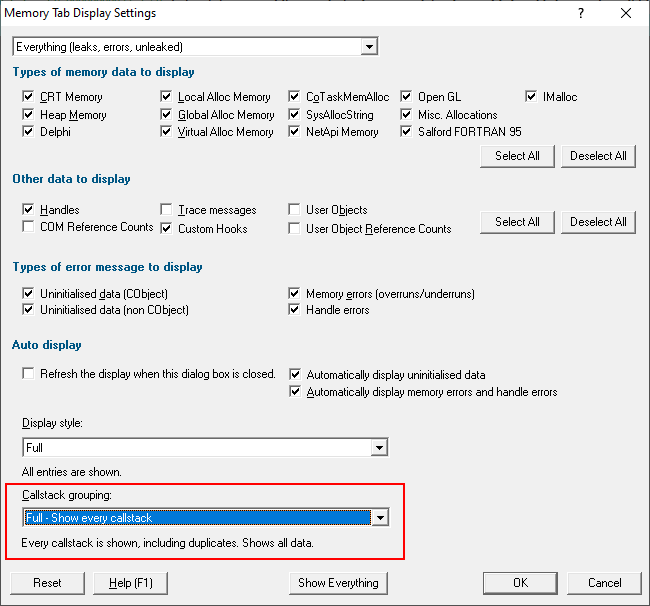
Click OK. - Click Refresh to update the display using the new display preferences.
- The display updates to show all allocations with a unique entry for each allocation.
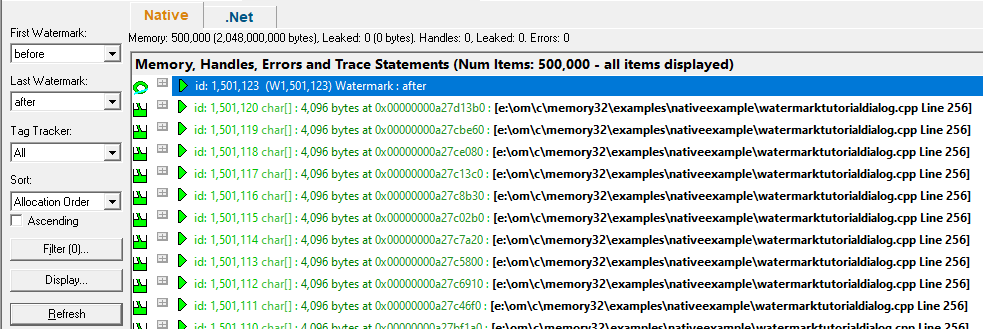
This is slower to display than the Simplified display and uses more memory.
For most use cases the Simplified display is preferable to the Full display, but for some bugs where you need to know the exact details of each allocation the Full display is the way to go.
Memory Validator can display up to 4 billion (4,294,967,295) allocations in this display – limited only by available memory in your computer (and your patience while populating that display!).
- Using the Watermarks dialog on native example, click Deallocate All.

-
You can see Memory Validator monitoring the memory deallocations as native example deallocates the memory.
Wait until the memory deallocations have been processed by Memory Validator.
-
You will also notice that the memory allocations displayed on the Memory tab do not go away despite being deallocated.
This is because Memory Validator knows you are inspecting them on the Memory tab.
If you refresh the display it will not show these deallocated memory allocations.
- Click Refresh.
- The Memory tab updates, showing no allocations between watermark “before” and watermark “after”.

Adding watermarks programmatically via the API
In this section we’re going to show you how to examine memory allocations part way through a transaction, before the objects get deallocated, with watermarks added via the API.
We assume that you have completed the Preamble above and have the Watermarks dialog open in native example.
You can continue on from the previous tutorial without restarting.
-
We need to change the display back to showing one callstack for many identical entries – to simplify the display to make it easier to read.
On Memory Validator’s Memory tab, click Display… to display the Memory Tab Display Settings dialog.
Change the Callstack grouping combo to Simplified and click OK.
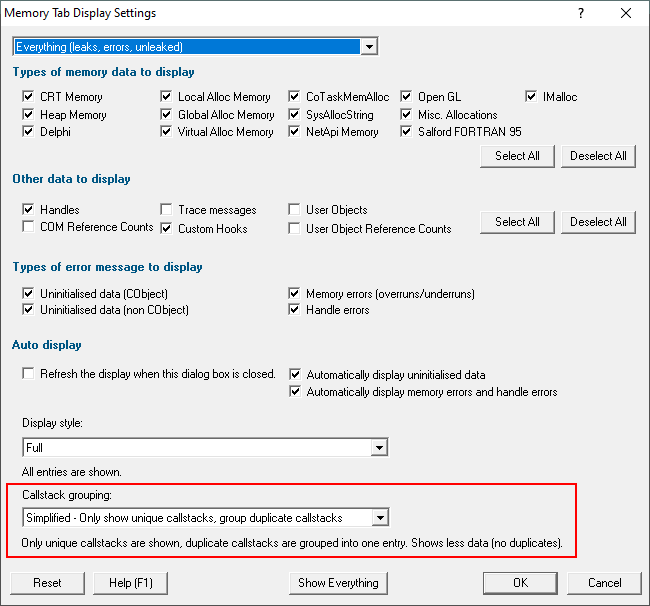
- On the Watermarks dialog on native example, select the Add Watermarks via the API check box.
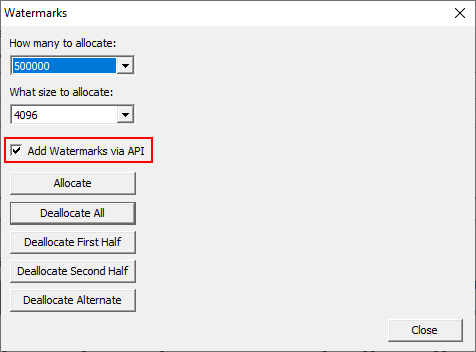
- Allocate some memory: click Allocate.
-
Watermarks will be added by native example before the memory allocations, and after the memory allocations. In this example these watermarks added via the API have the names beforeAlloc_n and afterAlloc_n where n is a number that increases each time the Allocate button is clicked.
The method for adding the watermark via the API is described in the Memory Validator help.
- You can see Memory Validator monitoring the memory allocations as native example allocates the memory.
- Let’s investigate the allocations between “beforeAlloc_4” and “afterAlloc_4”. The numbers for your example may be different depending on what you’ve done with the dialog during the tutorial.
- Go to the Memory tab on Memory Validator’s user interface.
- Change the First Watermark combo to “beforeAlloc_4”.
- Change the Last Watermark combo to “afterAlloc_4”.
- Click Refresh.
-
The display updates to show the memory allocated between “beforeAlloc_4” and “afterAlloc_4” which has not been deallocated.

The display sort order is descending, so most recent allocations are at the top. We can see watermark “afterAlloc_4”, a memory allocation in green that represents 500,000 memory allocations that have an identical callstack, and the watermark “beforeAlloc_4”.
The memory allocation in green indicates that Memory Validator has seen other memory allocations allocated with an identical callstack and those allocations have been deallocated. This isn’t a guarantee that this location doesn’t leak memory, but it’s a hint that this location may not leak memory.
The 500,000 memory allocations are displayed between the two watermarks, but occupy just one entry in the list because of Memory Validator’s display settings are set to “Simplified”.
- Using the Watermarks dialog on native example, click Deallocate All.

- You can see Memory Validator monitoring the memory deallocations as native example deallocates the memory.
-
You will also notice that the memory allocations displayed on the Memory tab do not go away despite being deallocated.
This is because Memory Validator knows you are inspecting them on the Memory tab.
If you refresh the display it will not show these deallocated memory allocations.
- Click Refresh.
- The Memory tab updates, showing no allocations between watermark “beforeAlloc_4” and watermark “afterAlloc_4”.

Conclusion
You have learned how to use watermarks to inspect memory between two watermarks, to inspect memory during a transaction and across a transaction.
You have also learned how to use watermarks created by using the Memory Validator API.
