Performance Validator Tutorials

The Tutorials

Getting Started

Why is Profiling Important?

Types of profiling: Sampling and instrumentation.

Callstack

Statistics and Relations.

Call Tree

Call Graph

Analysis

Line Timing

Identifying slow code.

How to profile only selected parts of your application.

How to exclude profiling MFC for statically linked and dynamically linked applications.

How to restrict instrumentation to specific parts of your application.

How to improve instrumentation speed.

Customizing embedded statistics.

Reseting statistics.

Using Stop and Start.

Performance profiling a .Net Core application

Performance profiling a .Net Core application child process

Performance profiling a service

Performance profiling for a service child process

Performance profiling an IIS ISAPI DLL

Performance Profiling ASP.Net with IIS

Performance profiling ASP.Net with Web Development Server

Command Line Performance Profiling a Child Process
Call Tree
This tutorial demonstrates launching the sample application and using the Call Tree view to identify the parts of the application that consume the most CPU time.
The Call Tree view presents the performance data as a hierarchical tree which can be expanded and collapsed at each node in the tree. This allows you to close parts of the tree that are of no interest, and open parts of the tree that appear more interesting – allowing you to easily identify the parts of the application that consume the most CPU time.
Sampling
This tutorial will demonstrate the Call Tree user interface using sampling mode.
- Click on the settings icon on the toolbar.

The settings dialog is displayed. On the Performance tab, choose the Sampling option – this ensures Performance Validator doesn’t spend time instrumenting your application – allowing for a rapid attachment to the application to enable you to get a quick view of the callstack when your application is under load. Click OK to accept the new settings. - Launch the sample application. Click on the relaunch icon on the toolbar to relaunch the most recently launched application.

- Using the sample application, select the Sort menu and choose Quick Sort.
- Using the sample application, select the Sort menu and choose Comb Sort.
- Using the sample application, select the Sort menu and choose Heap Sort.
- Using the sample application, select the Sort menu and choose Merge Sort.
- Using the sample application, select the Sort menu and choose Bubble Sort.
- Close nativeExample.exe using the File menu Exit command. The application closes. Performance Validator processes any remaining data and displays the final results.
- Select the Call Tree tab and click Refresh. The call tree display is updated. When using instrumentation mode, there are usually very few roots in the tree. When using sampling mode, the tree has many roots, depending on the callstacks collected for each sample.
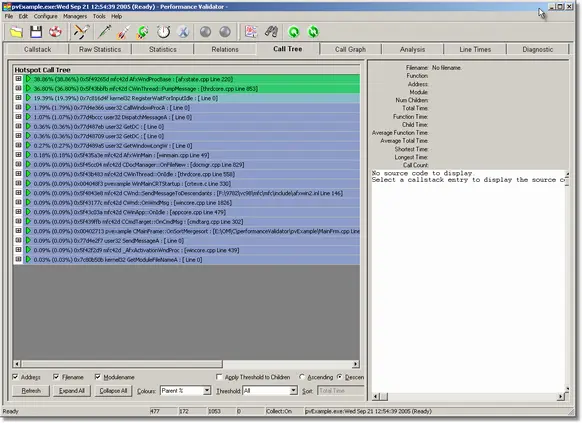
- Click Expand All to expand all the tree roots.
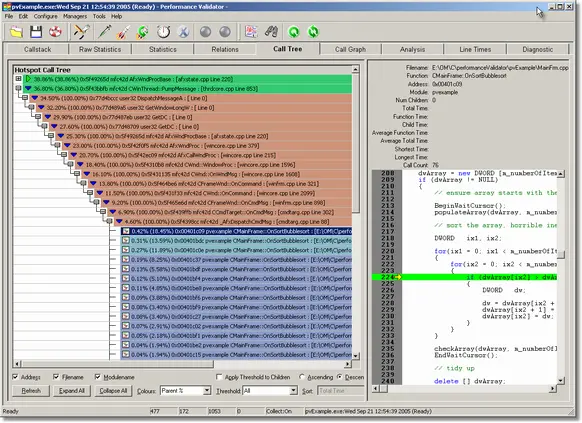
- Select an entry in the tree to display the source code on the right hand side.
Analysing the call tree.
- For sampled data the call tree does not provide any sorting options. Click Refresh to update the display.
- Expand the first node of the tree. The tree will look something like the image shown below. Ignore the “Ordinal” entries – this indicates the incorrect PDB is present (in this case for the MFC DLLs).
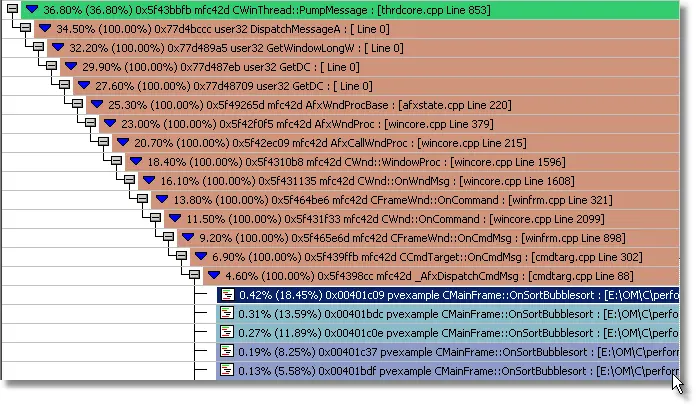 If you scroll down past the various sampled entries for CMainFrame::OnSortBubblesort() you will find some entries for the other sort functions.

- You can easily see that the Bubble sort accounted for more sample locations than the other sort types.
- Expand the two nodes corresponding to the Bubble sort and Heapsort.The tree will look something like this:
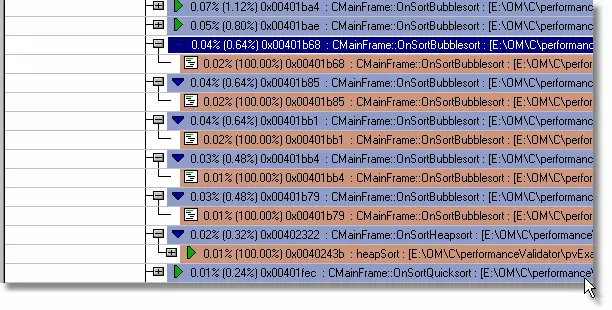
- The tree has many entries for the Bubble sort and only one entry for the Heapsort. It is clear that the Bubble sort took longer to execute – thus indicating the bubble sort requires further investigation to improve its performance.
Instrumentation
This tutorial will demonstrate the Call Tree user interface using instrumentation mode.
- Click on the settings icon on the toolbar.

The settings dialog is displayed. On the Performance tab, choose the Time Stamp Counter option. Click OK to accept the new settings. - Launch the sample application. Click on the relaunch icon on the toolbar to relaunch the most recently launched application.

- Using the sample application, select the Sort menu and choose Quick Sort.
- Using the sample application, select the Sort menu and choose Comb Sort.
- Using the sample application, select the Sort menu and choose Heap Sort.
- Using the sample application, select the Sort menu and choose Merge Sort.
- Using the sample application, select the Sort menu and choose Bubble Sort.
- Close nativeExample.exe using the File menu Exit command. The application closes. Performance Validator processes any remaining data and displays the final results.
- Select the Call Tree tab and set the Sort type to Total Time. Click Refresh. The call tree display is updated. When using instrumentation mode, there are usually very few roots in the tree. When using sampling mode, the tree has many roots, depending on the callstacks collected for each sample.
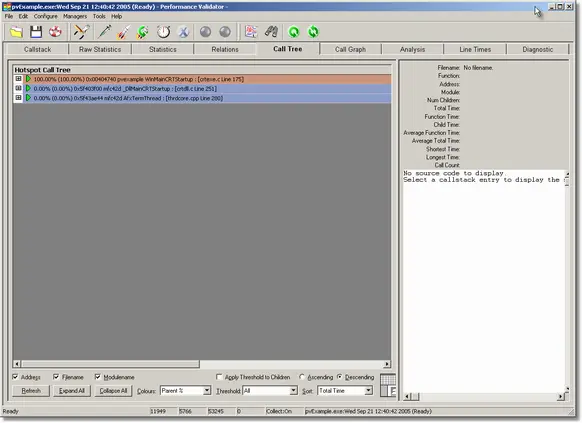
- Click Expand All to expand all the tree roots.
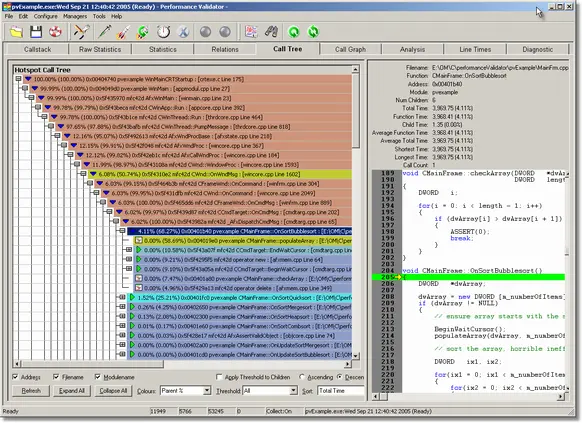
- Select an entry in the tree to display the source code on the right hand side.
- Examining the expanded tree you can easily identify which functions are consuming the most CPU time – in the picture above, the CMainFrame::OnBubbleSort() method is responsible for 4.11% of all samples.
Analysing the call tree.
- Choose the appropriate way to sort the tree (Total Time) using the Sort combo box and click Refresh.
- Expand the first node of the tree. The tree will look something like this:
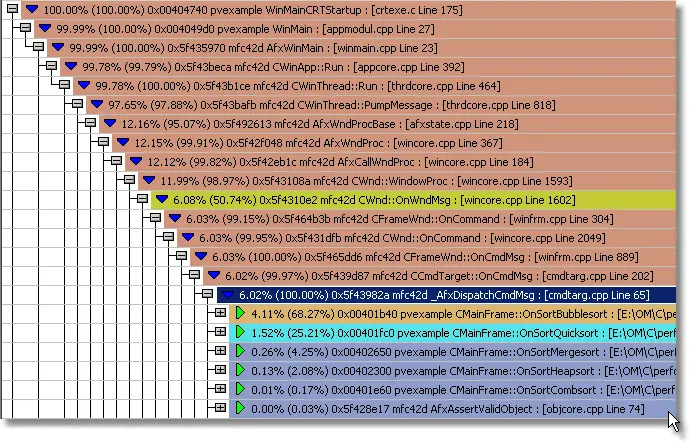
- You can easily see that the Bubble sort accounted for 68.27% of all time in this node and the Quicksort accounted for 25.21% of all time in this node.
- Expand the two nodes corresponding to the Bubble sort and Quicksort.The tree will look something like this:
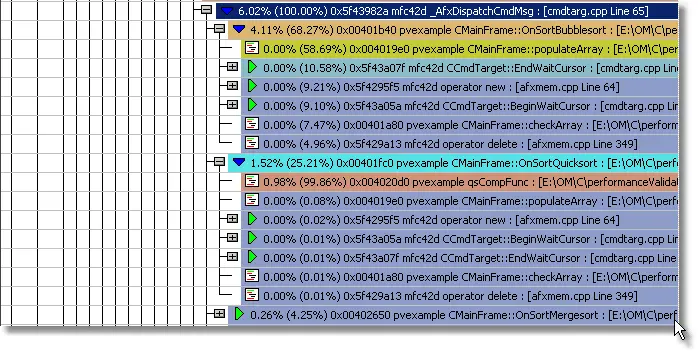
- We can see from the expanded tree that the bubble sort calls two functions which use very little of the 68.27%, thus implying that the bubble sort function itself is responsible for the time consumption.
- We can see from the expanded tree that the quick sort calls two functions which use very little of the 25.21%, and that the quicksort callback uses 99.86% of the 25.21%, leaving the quick sort function responsible for approximately 25% of the time consumption.
- It is clear that the Bubble sort function is almost 3 times as slow as the Quick sort for the test, and thus this area of the application needs further investigation and possibly work to improve its performance.