Performance Validator Tutorials

The Tutorials

Getting Started

Why is Profiling Important?

Types of profiling: Sampling and instrumentation.

Callstack

Statistics and Relations.

Call Tree

Call Graph

Analysis

Line Timing

How to profile only selected parts of your application.

How to exclude profiling MFC for statically linked and dynamically linked applications.

How to restrict instrumentation to specific parts of your application.

How to improve instrumentation speed.

Customizing embedded statistics.

Identifying slow code.

Reseting statistics.

Using Stop and Start.

Performance profiling a .Net Core application

Performance profiling a .Net Core application child process

Performance profiling a service

Performance profiling for a service child process

Performance profiling an IIS ISAPI DLL

Performance Profiling ASP.Net with IIS

Performance profiling ASP.Net with Web Development Server

Command Line Performance Profiling a Child Process
Selected Profiling
This tutorial describes how to use Performance Validator to profile only a specific part of your application.
Many techniques are available for restricting profiling – usually by not instrumenting a given part of your application. For example, excluding MFC and the C runtime from profiling may be useful. There are situations where this is not an appropriate method for restricting how profiling data is collected. You may want to include profiling data from MFC and the C runtime, but only collect the profiling data when the application’s execution is inside a particular function.
An example of this would be when a 3D CAD developer is profiling their application and wants to time the “render” function that generates the photo-realistic graphics. The developer is not interested in any profiling data from the main application framework (which also uses MFC and the C runtime), but the developer is interested in the profiling data from their rendering function and all functions called from that (other functions in the application, MFC, C runtime, Open GL graphics libraries, 3rd party 3D surface libraries and so on).
The above example is a real example from one of the world’s leading 3D mechanical CAD vendors – the facilities described in this tutorial were developed in response to the needs of their developers.
Three topics are available for this tutorial:
- Collecting data from a specific function.
- Preventing data collection from a specific function.
- Advanced Use.
Collecting data from a specific function
This tutorial demonstrates how to collect data from a specific function and those functions called from that function.
- Click on the settings icon on the toolbar.

The settings dialog is displayed. On the Performance tab, choose the Time Stamp Counter option. This option causes Performance Validator to instrument your application and to time various operations using the processor’s time stamp counter. If you do not want to use the time stamp counter you can choose one of the other instrumentation options.Note: You cannot perform selected data collection when in sampling mode, you must choose one of the instrumentation modes. - Select the Performance Collectors tab.
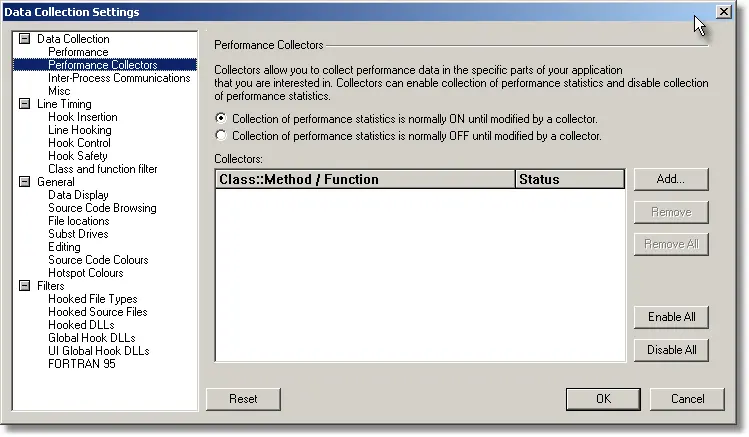
- Select the Collection of performance statistics is normally OFF until modified by a collector radio box so that performance data collection is disabled until the application enters a function marked as a collector.
- Click the Add… button to add a collector definition.
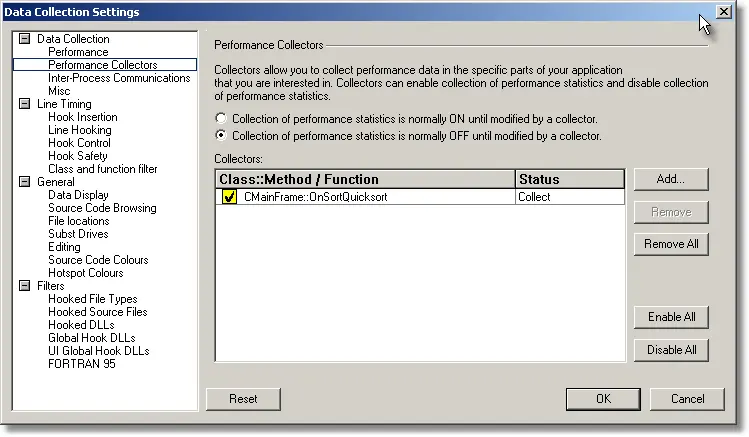
- Edit the Class::Method name to identify the class and method, or function to be marked as a collector. See the Performance Validator help (press F1) for more details on this area. For the purposes of the tutorial, we will restrict data collection to the CMainFrame::OnSortQuicksort() function. Type CMainFrame::OnSortQuicksort into the Class::Method / Function edit field. Leave the status set to Collect.Click OK to accept the new settings.
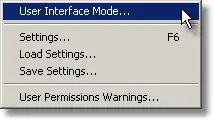
- Switch to dialog mode. On the Configure menu, choose User Interface Mode….
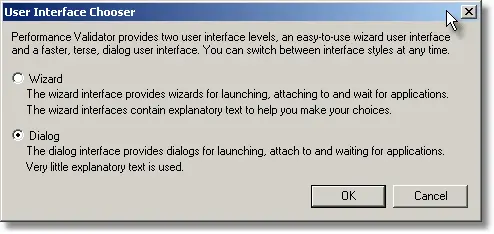
- The User Interface mode dialog is displayed. Choose Dialog and click OK to accept the choice.
- Click the launch button.

- The dialog mode launch dialog is displayed.
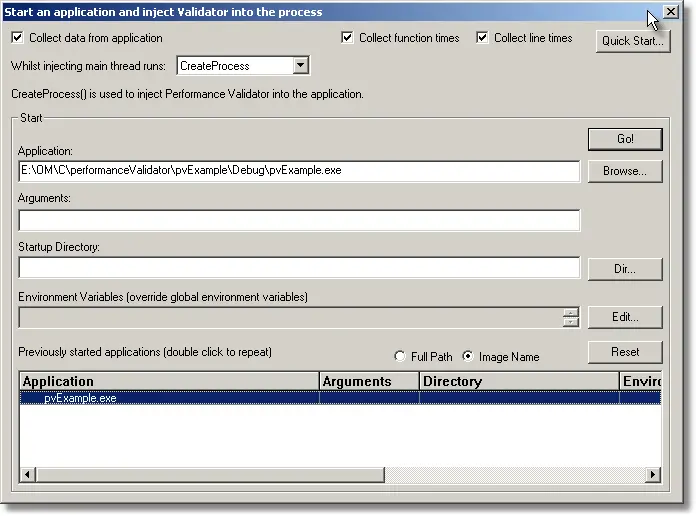
- Deselect the Collect line times check box to disable line timing (you can leave it enabled if you wish, we recommend this option is disabled unless you require it). Choose the nativeExample.exe entry in this history list and click the Go button. The application is launched.
- Using the sample application, select the Sort menu and choose Quick Sort.
- Using the sample application, select the Sort menu and choose Comb Sort.
- Using the sample application, select the Sort menu and choose Heap Sort.
- Using the sample application, select the Sort menu and choose Merge Sort.
- Using the sample application, select the Sort menu and choose Bubble Sort.
- Close nativeExample.exe using the File menu Exit command. The application closes. Performance Validator processes any remaining data and displays the final results.
- Click the Refresh All icon on the toolbar.

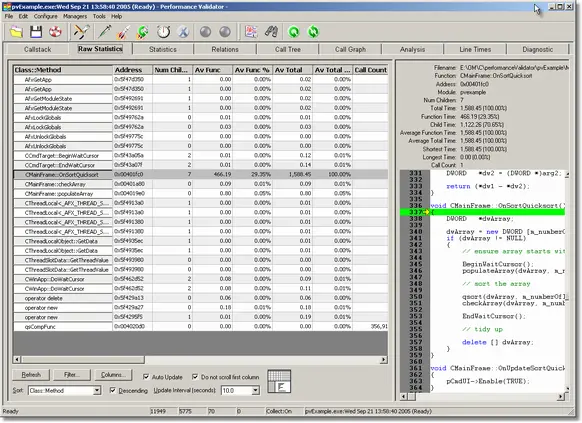
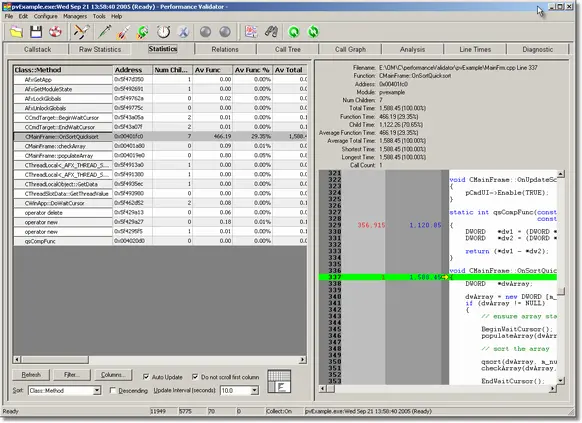
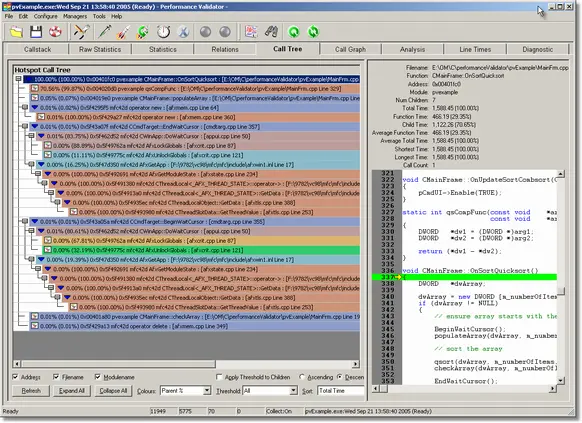
- Examining the Statistics, Relations, Call Tree tabs you can see that very little data is available – this is because the collector restricted performance data collection to all functions called whilst inside CMainFrame::OnSortQuicksort().
Preventing data collection from a specific function
This tutorial demonstrates how to exclude data collection from a specific function and those functions called from that function.
- Click on the settings icon on the toolbar.

The settings dialog is displayed. On the Performance tab, choose the Time Stamp Counter option. This option causes Performance Validator to instrument your application and to time various operations using the processor’s time stamp counter. If you do not want to use the time stamp counter you can choose one of the other instrumentation options.Note: You cannot perform selected data collection when in sampling mode, you must choose one of the instrumentation modes. - Select the Performance Collectors tab.

- Select the Collection of performance statistics is normally ON until modified by a collector radio box so that performance data collection is disabled until the application enters a function marked as a collector.
- Click the Add… button to add a collector definition.
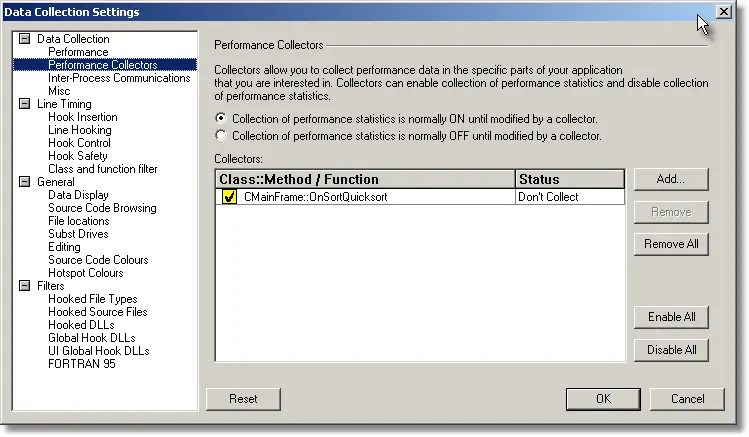
- Edit the Class::Method name to identify the class and method, or function to be marked as a collector. See the Performance Validator help (press F1) for more details on this area. For the purposes of the tutorial, we will restrict data collection to the CMainFrame::OnSortQuicksort() function. Type CMainFrame::OnSortQuicksort into the Class::Method / Function edit field. Leave the status set to Don’t Collect.Click OK to accept the new settings.
- Switch to dialog mode. On the Configure menu, choose User Interface Mode….

- The User Interface mode dialog is displayed. Choose Dialog and click OK to accept the choice.

- Click the launch button.

- The dialog mode launch dialog is displayed.

- Deselect the Collect line times check box to disable line timing (you can leave it enabled if you wish, we recommend this option is disabled unless you require it). Choose the nativeExample.exe entry in this history list and click the Go button. The application is launched.
- Using the sample application, select the Sort menu and choose Quick Sort.
- Using the sample application, select the Sort menu and choose Comb Sort.
- Using the sample application, select the Sort menu and choose Heap Sort.
- Using the sample application, select the Sort menu and choose Merge Sort.
- Using the sample application, select the Sort menu and choose Bubble Sort.
- Close nativeExample.exe using the File menu Exit command. The application closes. Performance Validator processes any remaining data and displays the final results.
- Click the Refresh All icon on the toolbar.

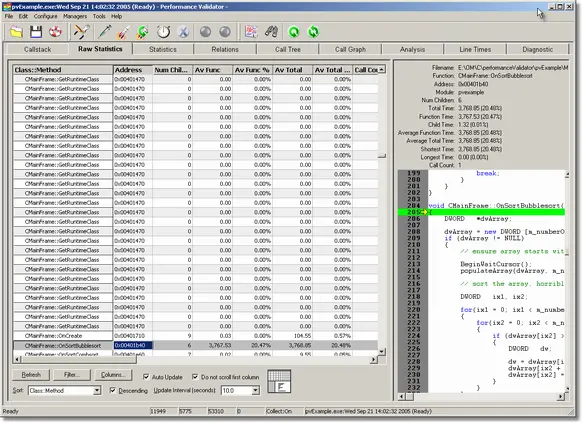
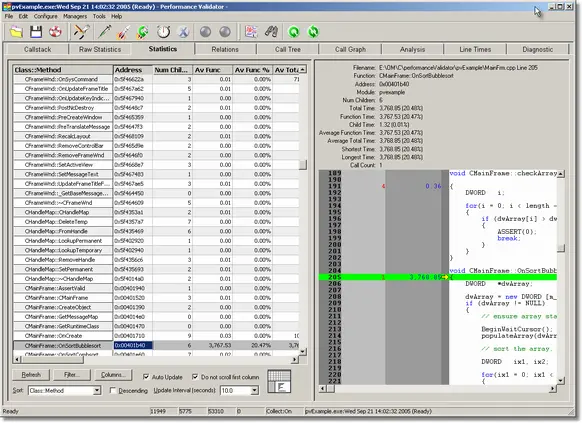
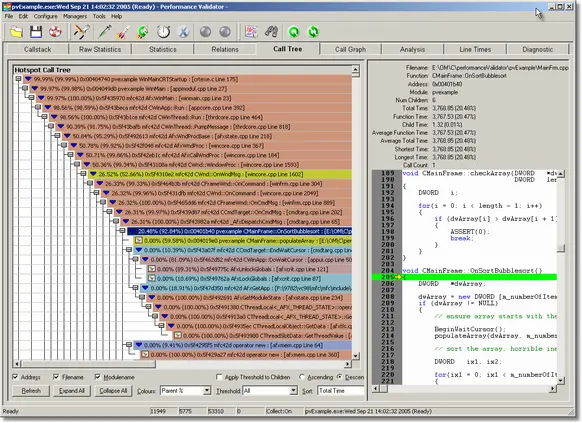
- Examining the Statistics, Relations, Call Tree tabs you can see that the data collected is similar to the data you would expect to be collected on a normal run of Performance Validator without the collectors. However, the performance data has no reference to any of the functions to do with Quick Sort – the collector excluded all data from inside CMainFrame::OnSortQuicksort().
Advanced Use
The above tutorials only specify one collector – you can specify as many collectors as you desire, with conflicting needs. For example you may have a function you wish to time that has a function call hierarchy as follows:
	Function1()
		Function2()
		Function3()
		Function4()
			Function2()
			Function5()
		Function6()
You could overall collection to OFF, create a collector for Function1(), set to “Collect” Then create another collector for Function4(), set to “Don’t Collect”. Performance Validator will then collect data for the following hierarchy, ignoring Function4() and any functions called from Function4().
	Function1()
		Function2()
		Function3()
		Function6()
Notice that Function2() is included in the data when called from Function1(), but not when called from Function4().