Performance Validator Tutorials

The Tutorials

Getting Started

Why is Profiling Important?

Types of profiling: Sampling and instrumentation.

Callstack

Statistics and Relations.

Call Tree

Call Graph

Analysis

Line Timing

How to profile only selected parts of your application.

How to exclude profiling MFC for statically linked and dynamically linked applications.

How to restrict instrumentation to specific parts of your application.

How to improve instrumentation speed.

Customizing embedded statistics.

Identifying slow code.

Reseting statistics.

Using Stop and Start.

Performance profiling a .Net Core application

Performance profiling a .Net Core application child process

Performance profiling a service

Performance profiling for a service child process

Performance profiling an IIS ISAPI DLL

Performance Profiling ASP.Net with IIS

Performance profiling ASP.Net with Web Development Server

Command Line Performance Profiling a Child Process
Identifying slow code
This tutorial describes an example series of steps which may be used to identify slowly performing code.
- Step 1 – Sampling Performance
- Step 2 – Instrumentation Performance #1
- Step 3 – Instrumentation Performance #2
- Step 4 – Line Timing
Step 1 – Sampling Performance
The first step in identify a performance drop is to use the sampling profiler – this has a low performance overhead and an instant attach to your application, allowing you to analyse the problem rapidly.
- Click on the settings icon on the toolbar.

The settings dialog is displayed. On the Performance tab, choose the Sampling option – this ensures Performance Validator doesn’t spend time instrumenting your application – allowing for a rapid attachment to the application to enable you to get a quick view of the callstack when your application is under load. Click OK to accept the new settings. - Launch the sample application. Click on the relaunch icon on the toolbar to relaunch the most recently launched application.

- Using the sample application, select the Sort menu and choose Quick Sort.
- Using the sample application, select the Sort menu and choose Comb Sort.
- Using the sample application, select the Sort menu and choose Heap Sort.
- Using the sample application, select the Sort menu and choose Merge Sort.
- Using the sample application, select the Sort menu and choose Bubble Sort.
- Close nativeExample.exe using the File menu Exit command. The application closes. Performance Validator processes any remaining data and displays the final results.
- Click the Refresh All icon on the toolbar.

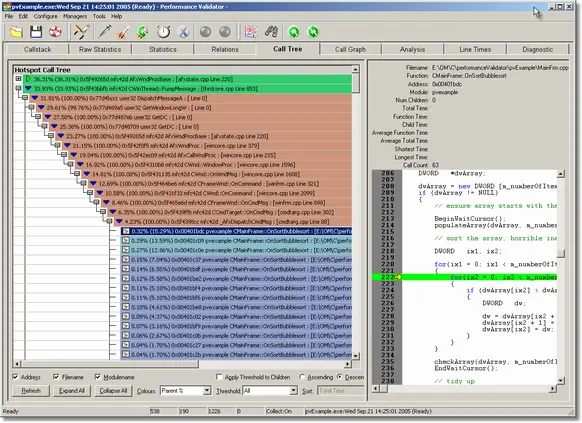
- Examining the Statistics, Relations, Call Tree tabs you can see statistics for all parts of the application. Due to the sampling nature of the profiling, the windows message loop appears to be present most of the time, however once you discard these entries from your consideration the most time consuming function is the bubble sort.
Step 2 – Instrumentation Performance #1
Step 1 allowed us to identify the part of the application that is of interest. In step 2 we switch to a more accurate timing method, combined with restricting the instrumentation to just the source of the application, ignoring all third party libraries, such as MFC and the C runtime.
- Identify part of application, restrict instrumentation based on this.
- Click on the settings icon on the toolbar.

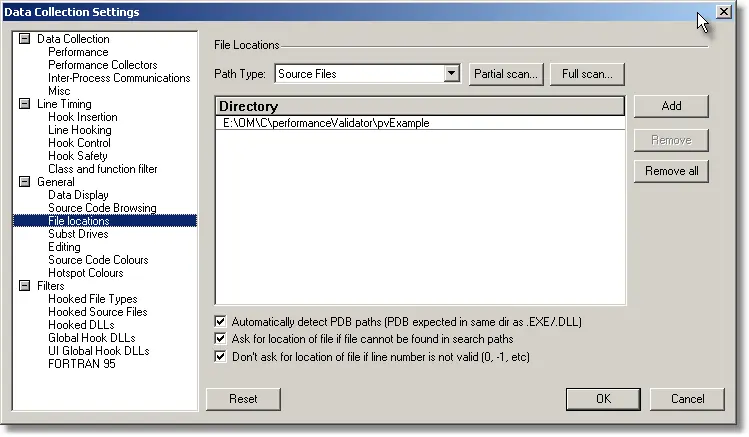
The settings dialog is displayed. On the Performance tab, choose the Time Stamp Counter option. This option causes Performance Validator to instrument your application and to time various operations using the processor’s time stamp counter. If you do not want to use the time stamp counter you can choose one of the other instrumentation options. - On the File locations tab, ensure that the application source code is specified for the Source Code Locations and the MFC and C runtime source code is specified for the Third Party Source Code.
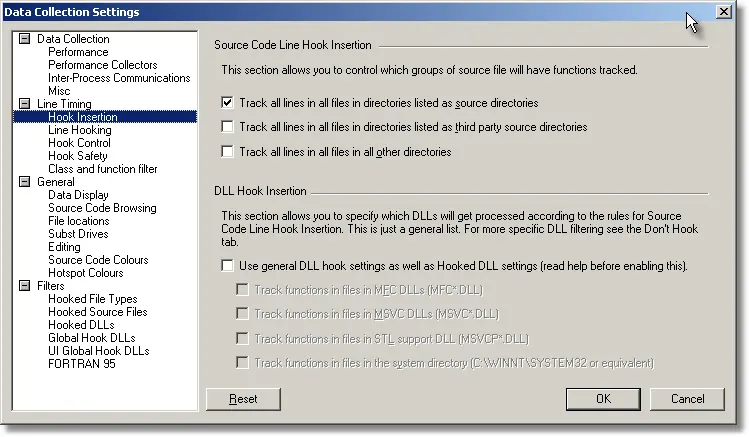
- On the Hook Insertion tab, deselect all check boxes in the lower half of the dialog.
- Click OK to accept the new settings.
- Launch the sample application. Click on the relaunch icon on the toolbar to relaunch the most recently launched application.

- Using the sample application, select the Sort menu and choose Quick Sort.
- Using the sample application, select the Sort menu and choose Comb Sort.
- Using the sample application, select the Sort menu and choose Heap Sort.
- Using the sample application, select the Sort menu and choose Merge Sort.
- Using the sample application, select the Sort menu and choose Bubble Sort.
- Close nativeExample.exe using the File menu Exit command. The application closes. Performance Validator processes any remaining data and displays the final results.
- Click the Refresh All icon on the toolbar.

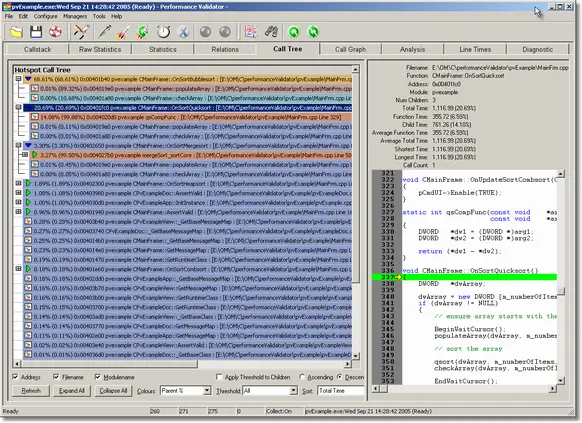
- Examining the Statistics, Relations, Call Tree tabs you can see that there are no statistics for the 3rd party libraries such as MFC and the C runtime, thus making the task of identifying the relevant statistics easier. The slowest function is the bubble sort. The statistics for this are more accurate.
Step 3 – Instrumentation Performance #2
Step 1 allowed us to identify the part of the application that is of interest. In step 2 we switched to a more accurate timing method, combined with restricting the instrumentation to just the source of the application, ignoring all third party libraries, such as MFC and the C runtime.
In step 3 we will restrict instrumentation to just the Mainfrm.cpp file, as this appears to be the file where all the work is performed. This step is not necessary for this trivial application, but for a more complex application this step may provide some benefit.
- Identify part of application, restrict instrumentation based on this.
- Click on the settings icon on the toolbar.

The settings dialog is displayed. On the Performance tab, choose the Time Stamp Counter option. This option causes Performance Validator to instrument your application and to time various operations using the processor’s time stamp counter. If you do not want to use the time stamp counter you can choose one of the other instrumentation options. - On the Hooked Source Files tab, select the Only hook… radio box, click the Add… button and select the MainFrm.cpp file in the nativeExample source directory.
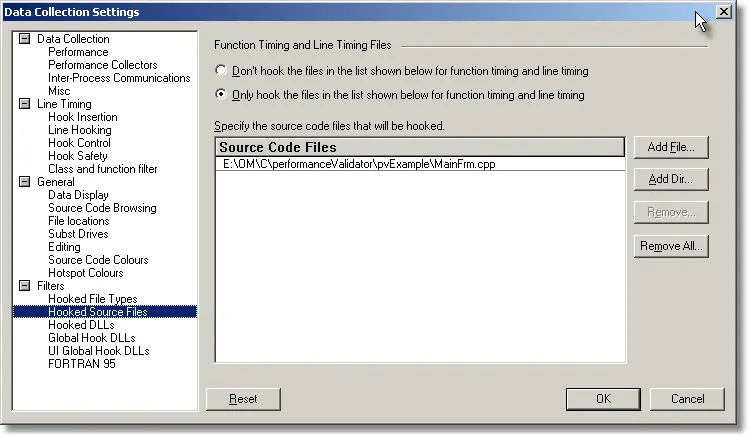
- Click OK to accept the new settings.
- Launch the sample application. Click on the relaunch icon on the toolbar to relaunch the most recently launched application.

- Using the sample application, select the Sort menu and choose Quick Sort.
- Using the sample application, select the Sort menu and choose Comb Sort.
- Using the sample application, select the Sort menu and choose Heap Sort.
- Using the sample application, select the Sort menu and choose Merge Sort.
- Using the sample application, select the Sort menu and choose Bubble Sort.
- Close nativeExample.exe using the File menu Exit command. The application closes. Performance Validator processes any remaining data and displays the final results.
- Click the Refresh All icon on the toolbar.

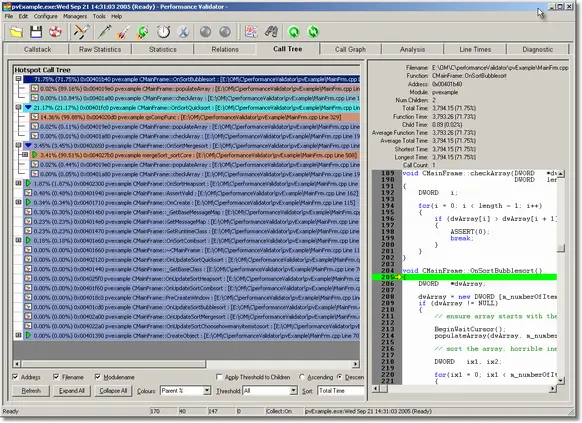
- Examining the Statistics, Relations, Call Tree tabs you can see that there are only statistics relating to the source file MainFrm.cpp, thus making the task of identifying the relevant statistics easier. The slowest function is the bubble sort. The statistics for this are more accurate.
Step 4 – Line Timing
In steps 1, 2, 3 we identified the particular function responsible for the poor performance, using different methods to restrict the amount of data gathered. In step four we will identify which source code lines are responsible for the poor performance.
-
- Click on the settings icon on the toolbar.

The settings dialog is displayed. On the Performance tab, choose the Time Stamp Counter option. This option causes Performance Validator to instrument your application and to time various operations using the processor’s time stamp counter. If you do not want to use the time stamp counter you can choose one of the other instrumentation options. Click OK to accept the new settings. - Click the launch button.

- The dialog mode launch dialog is displayed.
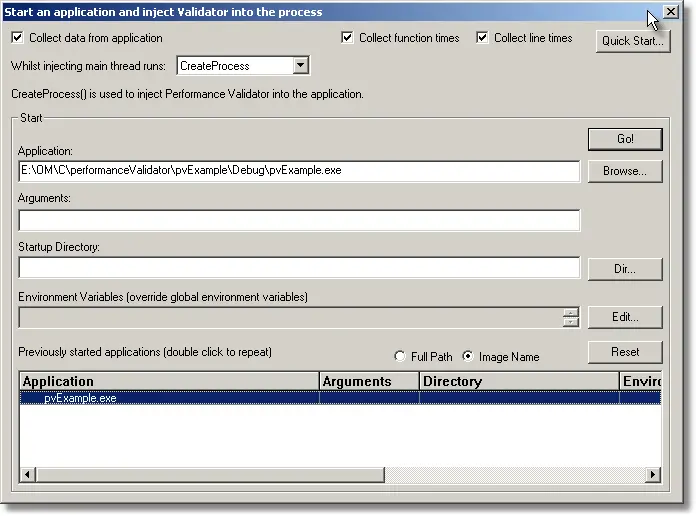
- Select the Collect line times check box. Choose the nativeExample.exe entry in this history list and click the Go button. The application is launched.
- Using the sample application, select the Sort menu and choose Quick Sort.
- Using the sample application, select the Sort menu and choose Comb Sort.
- Using the sample application, select the Sort menu and choose Heap Sort.
- Using the sample application, select the Sort menu and choose Merge Sort.
- Using the sample application, select the Sort menu and choose Bubble Sort.
- Close nativeExample.exe using the File menu Exit command. The application closes. Performance Validator processes any remaining data and displays the final results.
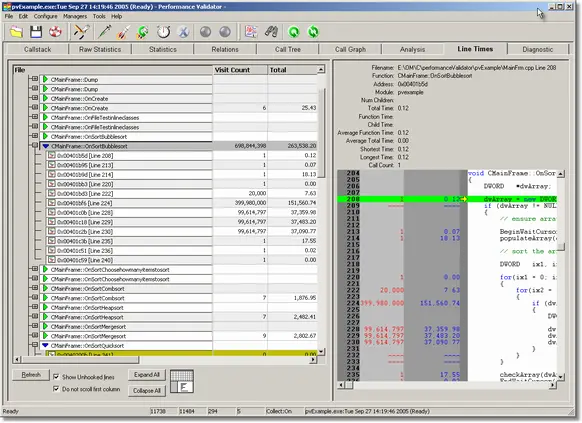
- Examining the Line Timing tab we can expand the entry related to the bubble sort to show the line timings for the bubble sort algorithm. The statistics clearly identify the comparison in the inner loop being compared X times, with Y data swaps. This area of code needs improvement.
- Click on the settings icon on the toolbar.
Conclusion
The above is a simple, if contrived, example. For a more extensive application you may choose to make use of Performance Collectors to only collect data inside certain functions, or you may choose to restrict instrumentation based on criteria useful to your application.