Performance Validator Tutorials

The Tutorials

Getting Started

Why is Profiling Important?

Types of profiling: Sampling and instrumentation.

Callstack

Statistics and Relations.

Call Tree

Call Graph

Analysis

Line Timing

How to profile only selected parts of your application.

How to exclude profiling MFC for statically linked and dynamically linked applications.

How to restrict instrumentation to specific parts of your application.

How to improve instrumentation speed.

Customizing embedded statistics.

Identifying slow code.

Reseting statistics.

Using Stop and Start.

Performance profiling a child process

Performance profiling a .Net Core application

Performance profiling a .Net Core application child process

Performance profiling a service

Performance profiling for a service child process

Performance profiling an IIS ISAPI DLL

Performance Profiling ASP.Net with IIS

Performance profiling ASP.Net with Web Development Server

Command Line Performance Profiling a Child Process
Performance profiling a .Net Core application
This tutorial demonstrates launching a .Net Core application, closing the application and inspecting the profiling results.
Related tutorials:
Performance profiling a child process.
Performance profiling a service.
Performance profiling a child process of a service.
Performance profiling an IIS ISAPI DLL.
Performance profiling ASP.Net with IIS.
Performance profiling ASP.Net with Web Development Server.
Building the example application
For this tutorial we’re going to work with dotNetCoreLauncher which is located in <Performance Validator install directory>\examples\dotNetCore\dotNetCoreLauncher.
You will need to build this with Visual Studio 2019 (.Net Core 5) or Visual Studio 2022 (.Net Core 6). A solution file is provided for each version. If you’ve installed in the default program files location you’ll need to run Visual Studio in administrator mode to do the build.
We’re going to show you how to performance profile Framework dependent .Net Core applications and also how to performance profile self contained .Net Core applications .
Publishing the application
Publishing the .Net Core application allows you to create an application that is framework dependent, or which is self contained.
The following command will create a framework dependent version and a self contained x64 version using Visual Studio 2019 and Visual Studio 2022.
Open a command prompt with administrator privileges.
cd c:\Program Files (x86)\Software Verify\Performance Validator x64\examples\dotNetCore
publish.bat
You can also use publish_vs2019.bat and publish_vs2022.bat for use with specific versions of Visual Studio.
Framework dependent .Net Core
- Launch the sample application. Click on the launch icon on the toolbar.

- The Launch Application or Service dialog is displayed.
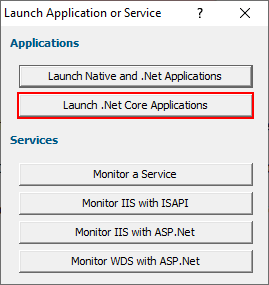
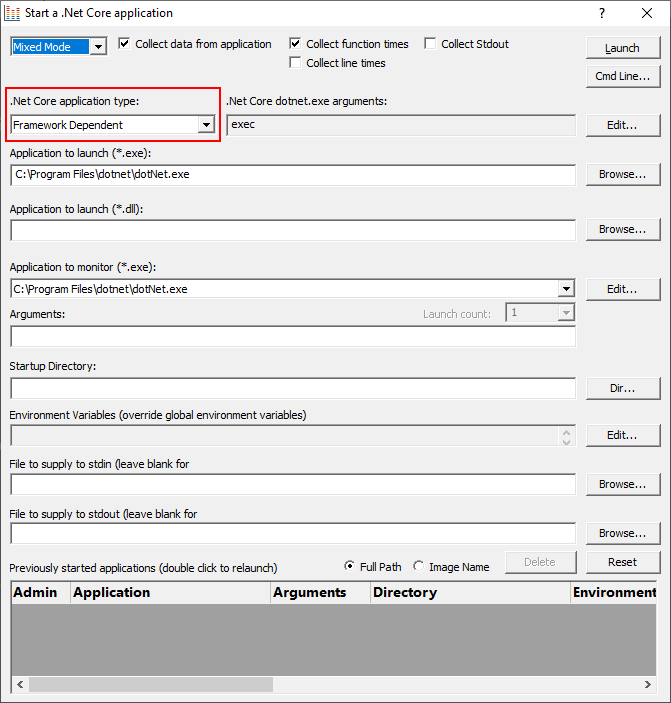
- Click Launch .Net Core Applications. The Launch .Net Core application dialog is displayed. By default it is configured for Framework Dependent .Net Core applications. You can change that from the .Net Core Application Type combo. For this tutorial we’ll leave it set to Framework Dependent.
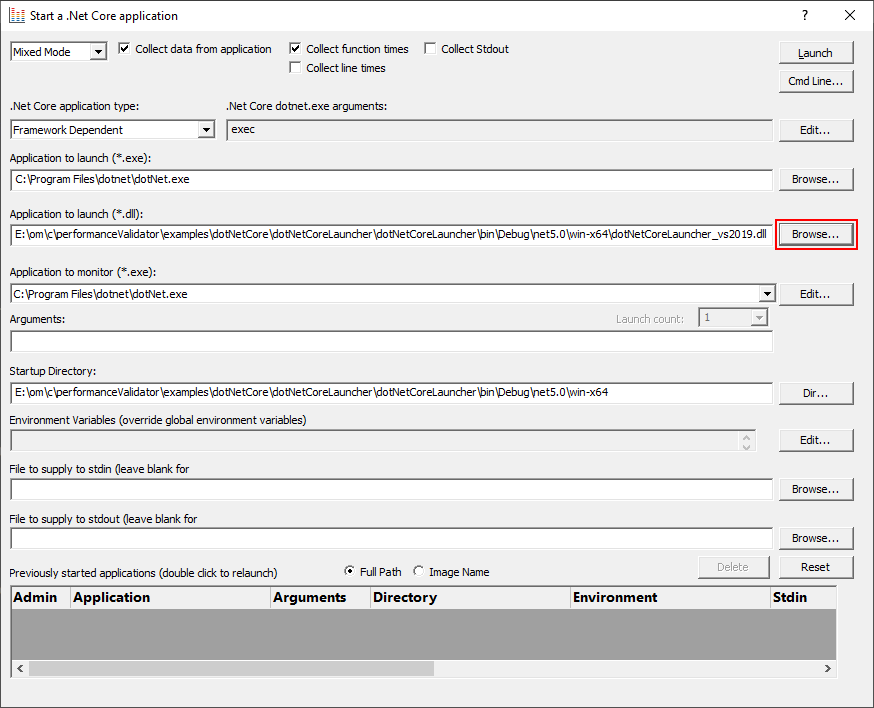
- Select the dotNetCoreLauncher_vs2019.dll using the Browse… button next to the Application to launch (*.dll) field. When you do this the Application to launch (*.exe) and Application to Monitor fields are populated with the .Net Core runtime, and the Application to launch (*.dll) is populated with the choice of dll.
- Click the Launch button to launch the application.
- The .Net Core dotNet.exe runtime is started to run the dotNetCoreLauncher_vs2019.dll application.
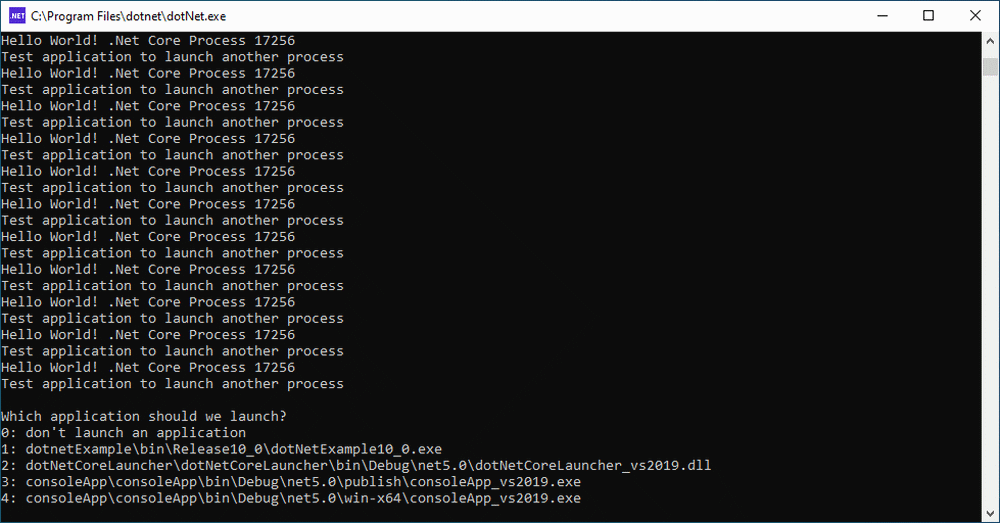
- Whilst Performance Validator is instrumenting the application various progress dialogs are displayed. The Statistics display of Performance Validator updates to timing statistics for all executed functions.
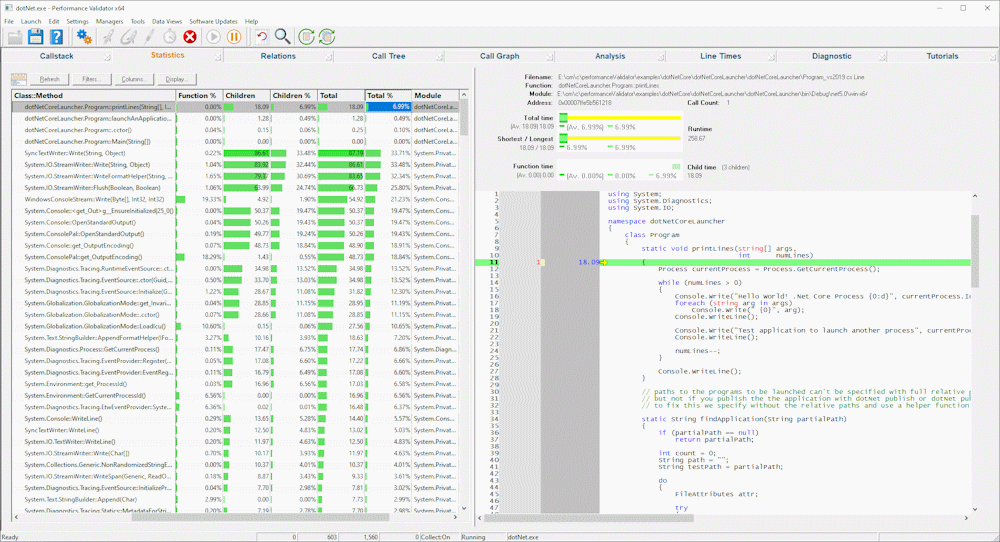
- Close dotNetLauncher by making a choice between 0 and 4. Any other choice repeats the menu. The application closes. Performance Validator processes any remaining data and displays the final results.
- The profiling results are displayed on the Statistics tab. These have been discussed in previous tutorials, we will not repeat that discussion here.
Self Contained .Net Core
- Launch the sample application. Click on the launch icon on the toolbar.

- The Launch Application or Service dialog is displayed.

- Click Launch .Net Core Applications. The Launch .Net Core application dialog is displayed. Change the .Net Core application type to Self Contained using the .Net Core Application Type combo.
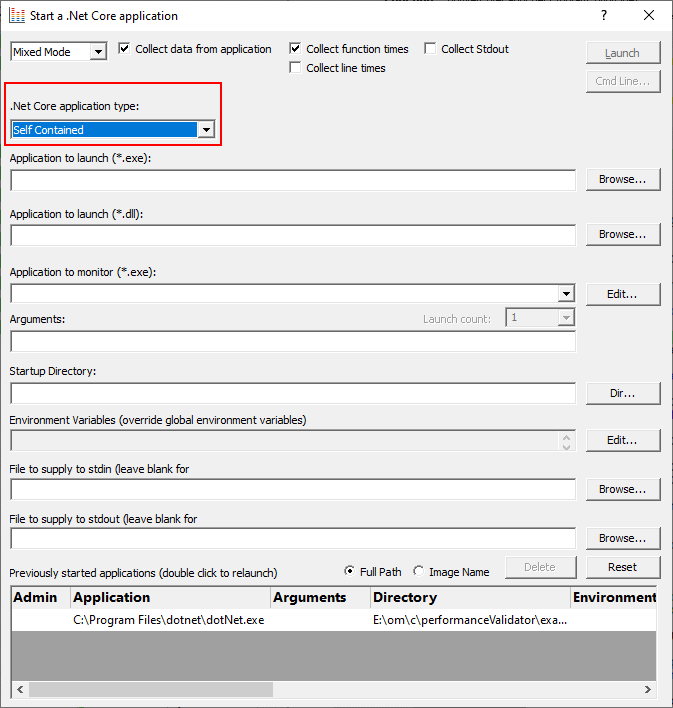
- Select the dotNetCoreLauncher_vs2019.exe using the Browse… button next to the Application to launch (*.exe) field. When you do this the Application to launch (*.dll) and Application to Monitor fields are populated with the executable, and the Application to launch (*.dll) is populated with a .Net Core dll that has the same name as the executable.
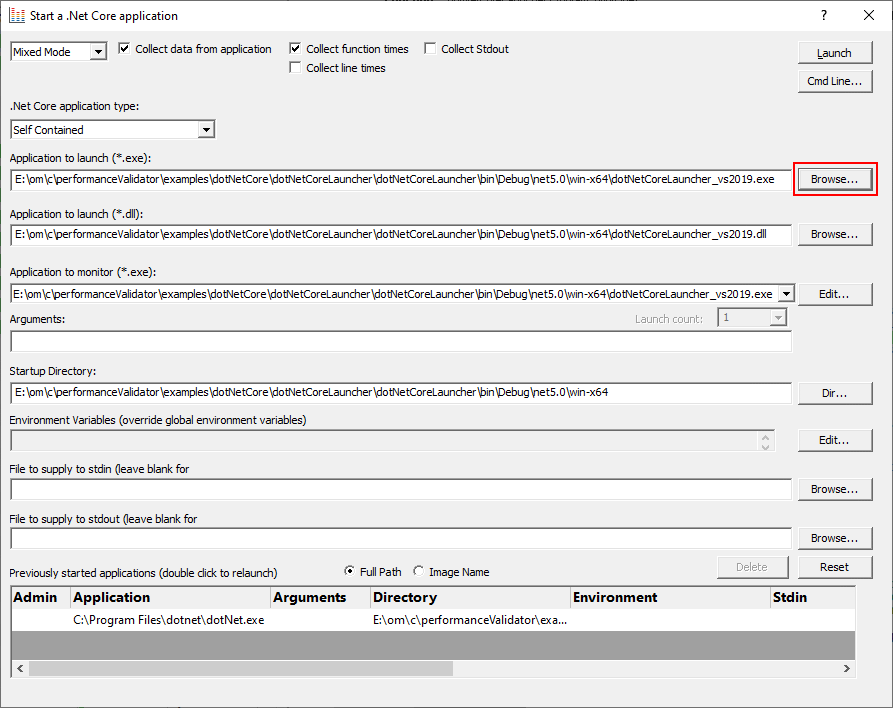
- Click the Launch button to launch the application.
- The .Net Core dotNetCoreLauncher_vs2019.exe runtime is started to run the dotNetCoreLauncher_vs2019.dll application.

- Whilst Performance Validator is instrumenting the application various progress dialogs are displayed. The display of Performance Validator updates to show the names of source code files and statistics about each file.
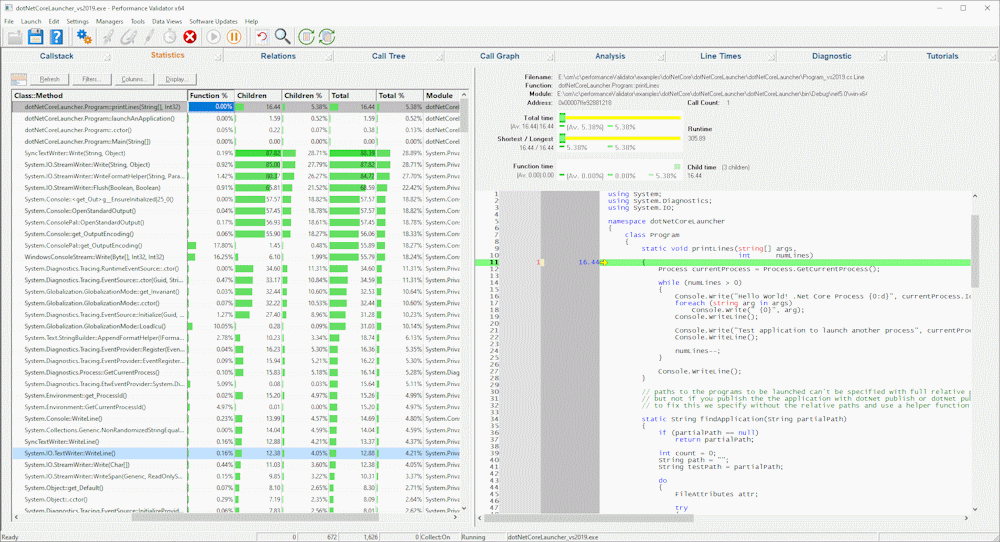
- Close dotNetLauncher by making a choice between 0 and 4. Any other choice repeats the menu. The application closes. Coverage Validator processes any remaining data and displays the final results.
- The profiling results are displayed on the Statistics tab. These have been discussed in previous tutorials, we will not repeat that discussion here.