Thread Validator Tutorials

The Tutorials

Getting Started

User Interface Mode

How to interpret the thread validator displays

Analysing an Application

Good Lock Strategy

Deadlock using two threads

Potential deadlock caused by incorrect locking strategy.

Potential deadlock caused by an infinite wait.

Leaving an unlocked critical section.

Deleting a locked critical section.

Leaving a critical section in the wrong order.

Identifying deadlock objects when not collecting callstacks.

Analysing an existing deadlocked application.

Getting information about a threading error.

Detecting deadlocks in a child process

Detecting deadlocks in a service

Detecting deadlocks in a service child process

Detecting deadlocks in an IIS ISAPI DLL

Command Line Deadlock Detection in a Child Process
Thread Errors
This tutorial demonstrates using Thread Validator to monitor an application and then query information about the application using the Analysis tab.
Note that for your executing nativeExample your critical section addresses, thread Ids and sequence numbers will all be different. We have used the values that we experienced to write this tutorial. Substitute your own values where appropriate.
- Open the settings dialog by clicking on the tools icon on the toolbar.

- In Novice mode, select the Out of order critical sections check box. Select the Potential deadlock check box. Select both the check boxes related to callstacks. Click OK.
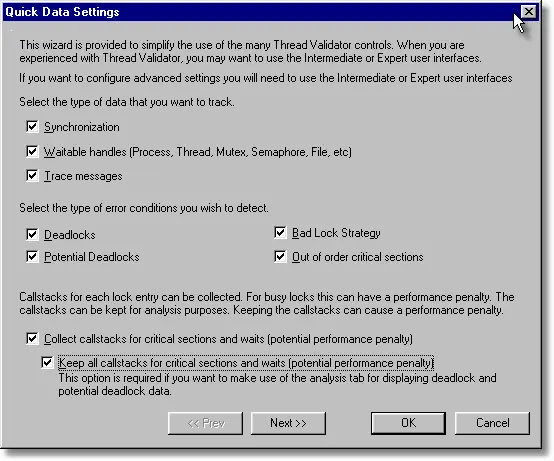
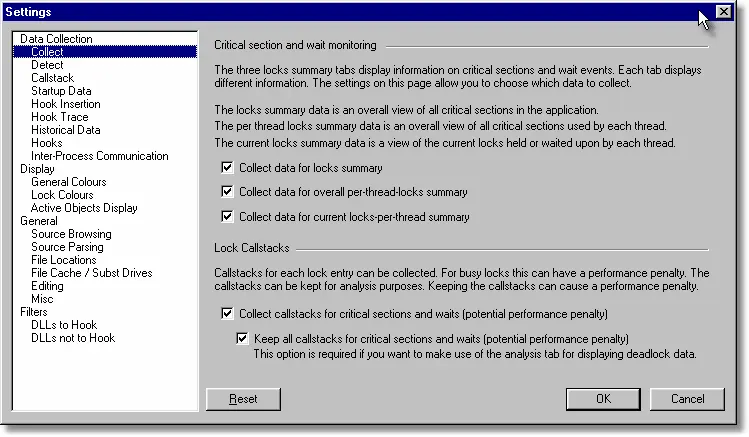
- In Intermediate mode or Expert mode, select the Collect tab and select both the check boxes related to callstacks.
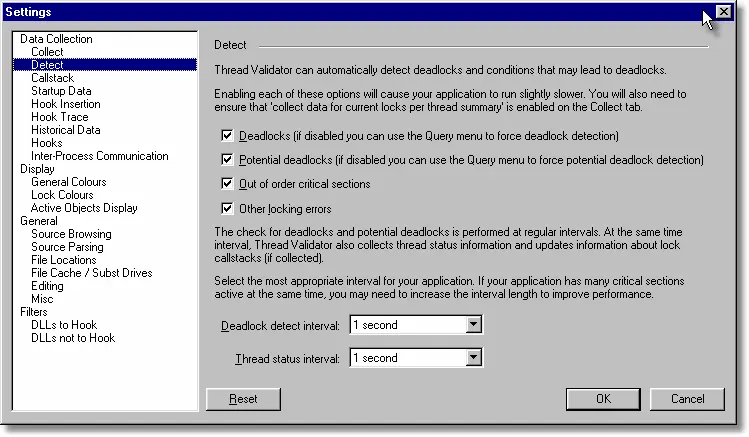
- Select the Detect tab and select the Out of order critical sections check box. Select the Potential deadlock check box.
- Click OK
- In Novice mode, select the Out of order critical sections check box. Select the Potential deadlock check box. Select both the check boxes related to callstacks. Click OK.
- Launch the sample application. Click on the re-launch icon on the toolbar.

- The previously launched application is started.
- From the Test menu, choose Leave critical sections in the wrong order.
- From the Test menu, choose Leave non-entered critical section.
- From the Test menu, choose Delete still active critical section.
- Using Thread Validator, choose the Analysis tab.
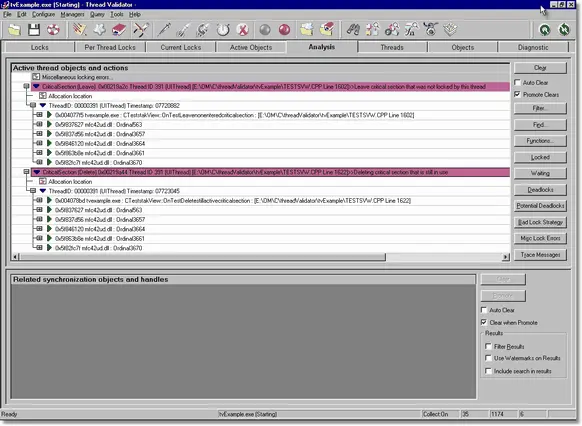
- Click the Misc Lock Errors button. The display lists all critical section objects with errors associated with them. In this example, the critical sections list are for leaving a non-entered critical section and deleting a still active critical section.
- Click the Clear button. The display is cleared.
- Click the Bad Lock Strategy button. The display lists all critical section objects with bad lock strategy associated with them. In this example, the critical sections list are for leaving a critical sections in the wrong order. The errors listed under Misc Errors are also listed as they can cause problems.
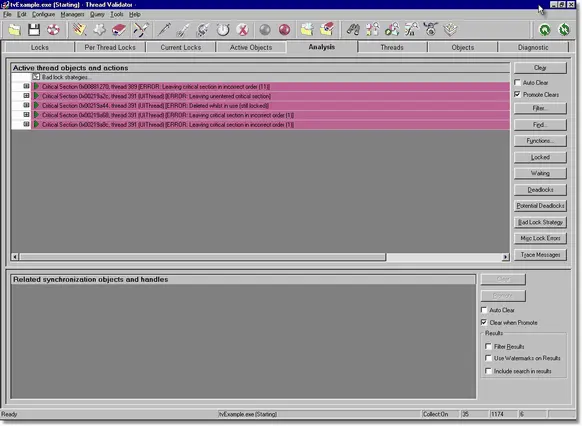
- Select the Auto Clear check box.
- On the example application Test menu, choose Potential deadlock, 2 threads.
- On the analysis tab, click the Potential Deadlocks button. The display is cleared (because the Auto Clear check box is selected) and any critical sections involved in potential deadlocks are listed.
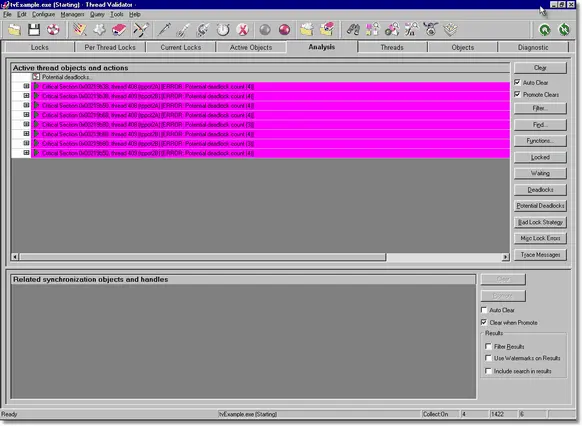
- On the example application Test menu, choose Start 3 thread deadlock.
- On the analysis tab, click the Deadlocks button. The display is cleared (because the Auto Clear check box is selected) and any critical sections involved in deadlocks are listed.
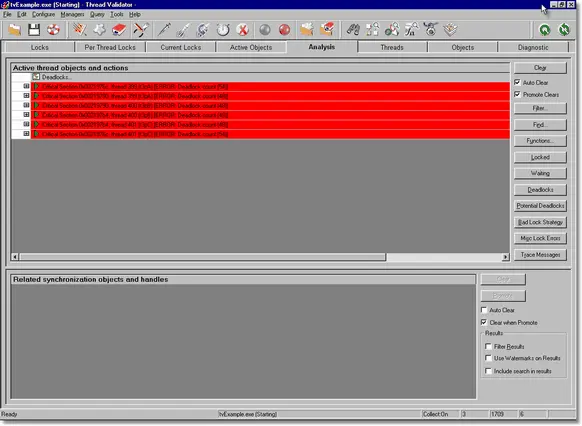
- Right click on any of the deadlock entries. A context menu is displayed. Choose the Relations submenu, then choose Same location, all callstacks. All callstacks that have the same location as the locking callstack location are displayed in the lower window. This is a powerful feature that allows you to find related information to any data shown in the top window. Selected data in the lower window can be promoted to the top window for further analysis.