Thread Validator Tutorials

The Tutorials

Getting Started

User Interface Mode

How to interpret the thread validator displays

Analysing an Application

Good Lock Strategy

Deadlock using two threads

Potential deadlock caused by incorrect locking strategy.

Potential deadlock caused by an infinite wait.

Leaving an unlocked critical section.

Deleting a locked critical section.

Leaving a critical section in the wrong order.

Identifying deadlock objects when not collecting callstacks.

Analysing an existing deadlocked application.

Getting information about a threading error.

Detecting deadlocks in a child process

Detecting deadlocks in a service

Detecting deadlocks in a service child process

Detecting deadlocks in an IIS ISAPI DLL

Command Line Deadlock Detection in a Child Process
Understanding the Displays
Thread Validator provides three principal displays for providing information about running threads and the critical sections and wait operations performed by each thread. The first tab, Summary, provides an overview of each critical section and thread. The second tab, Thread Locks provides a view of each critical section used by each thread and each wait performed by each thread.. The third tab, Current Locks provides a view of the currently locked critical sections and any WaitForXXX() calls that are in operation.
The different tabs provide similar, related information. However each tab provides a different perspective on your application – and as such, a different insight into the behaviour of your application. For some tasks you will be able to use any tab, for tasks you may see something on the Summary tab that leads you to examine data in the other two tabs or to move to the Analysis tab to perform a query.
Each of the tabs provides a context menu. The context menu provides the ability to edit the source code indicated in Owning Module column, examine callstacks associated with the critical section or wait, and display a modeless dialog box containing extra information about the thread, critical section or wait.
Locks

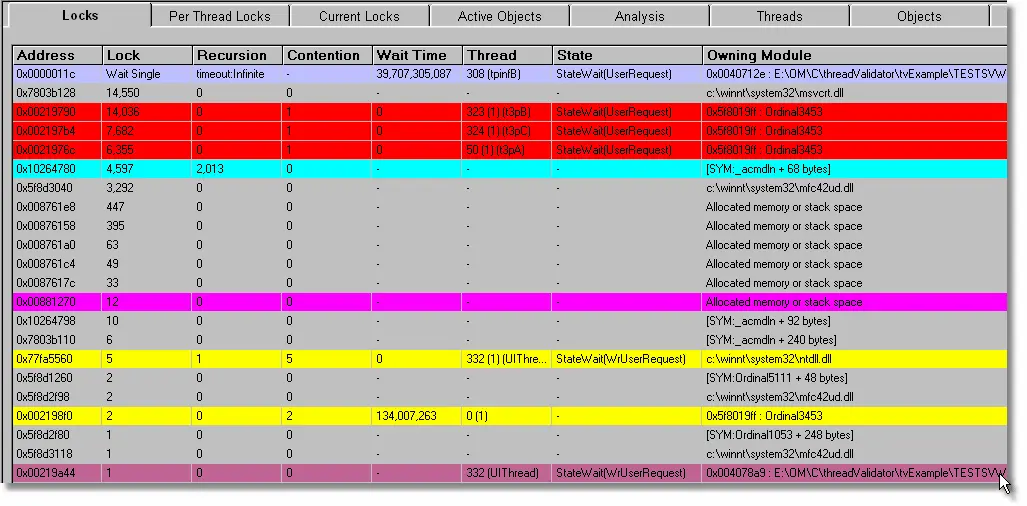
The Locks tab shows all critical sections in use. In use means currently “initialised”. Each critical section is only shown once, regardless of how many threads have used it. WaitForXXXObject(s) are also shown. Any critical sections that have errors associated with them (purple in the case of this picture, leaving a critical section in the wrong order) are also shown.
Per Thread Locks

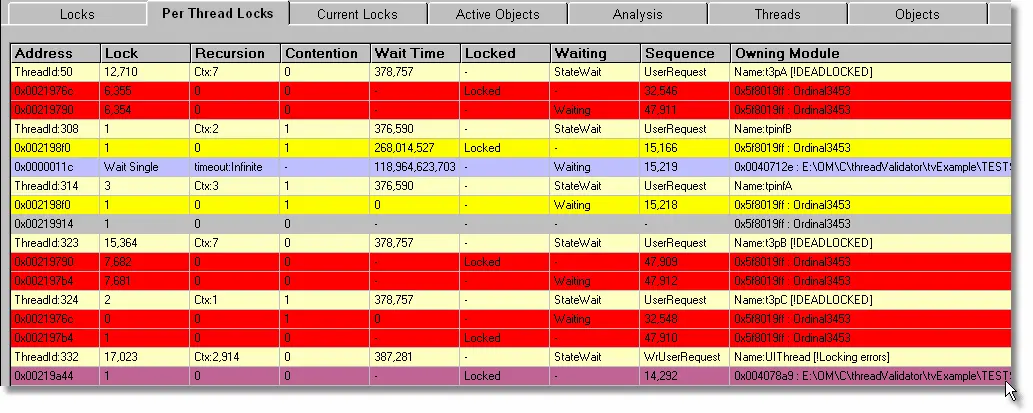
The Per Thread Locks tab shows all critical sections and WaitForXXXObject(s) on a per-thread basis. As you can see from the picture, thread 353 has had access to three critical section, thread 352 has had access to three critical sections and thread 285 has has access to two critical sections, both of which were exited in the wrong order. The entries highlighted in bright yellow indicate that the thread had contended access whilst trying to access this critical section.
Current Locks

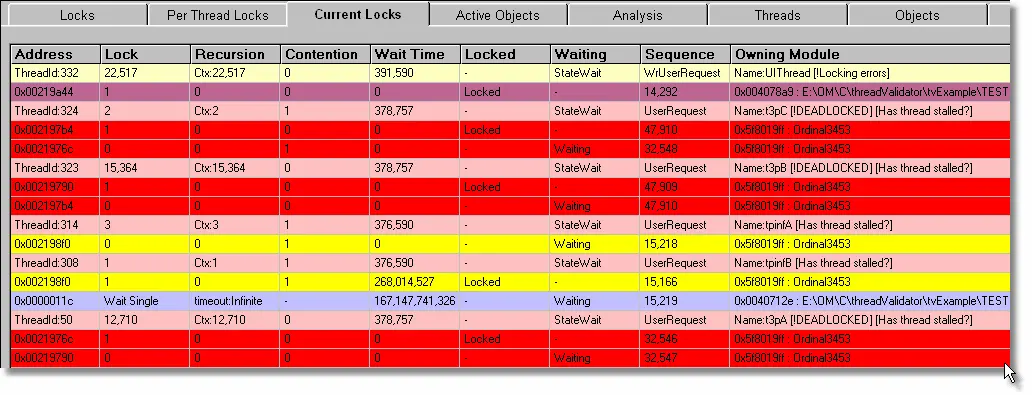
The Current Locks tab shows only the critical sections and WaitForXXXOBject(s) that are currently involved in locking or waiting activity. The display also shows any critical sections that have errors associated with them. As you can see from the picture one thread owns three locks, and two other threads are waiting.
Locks (showing errors)

The above image shows the Locks tab for an application with several serious errors. You can see from this picture that:
- Three threads are deadlocked (bright red) and that each deadlocked thread has one other thread waiting for access to the same critical section.
- There is an infinite wait occuring on handle 0x011c (blue).
- A critical section was deleted whilst still locked (dark red).
- Various other errors or critical section statuses are displayed.
Per Thread Locks (showing errors)

The above image shows the Per Thread Locks tab for an application with several serious errors. This image displays all critical sections that have been used by each thread and that are still active (initialised). You can see from this picture that:
- Thread 50 has 2 deadlocked critical sections (bright red).
- Thread 308 has one locked critical section and is in an infinite wait on handle 0x012c (blue).
- Thread 314 has accessed two critical sections and is waiting.
- Thread 323 has accessed two critical section, both of which are deadlocked.
- Thread 324 has accessed two critical section, both of which are deadlocked.
- Thread 332 has accessed 1 critical section, making an error in handling one of them (dark red).
Current Locks (showing errors)

The above image shows the Current Locks tab for an application with several serious errors. This image displays the current locks and wait operations per thread. You can see from this picture that:
- Thread 332 has accessed 1 critical section, making an error in handling one of them (dark red).
- Thread 324 has accessed two critical section, both of which are deadlocked.
- Thread 323 has accessed two critical section, both of which are deadlocked.
- Thread 314 is waiting for a critical section.
- Thread 308 has one locked critical section and is in an infinite wait on handle 0x012c (blue).
- Thread 50 has 2 deadlocked critical sections (bright red).
Note that this view does not provide information about other critical sections used by each thread that the Per Thread Locks tab does provide.