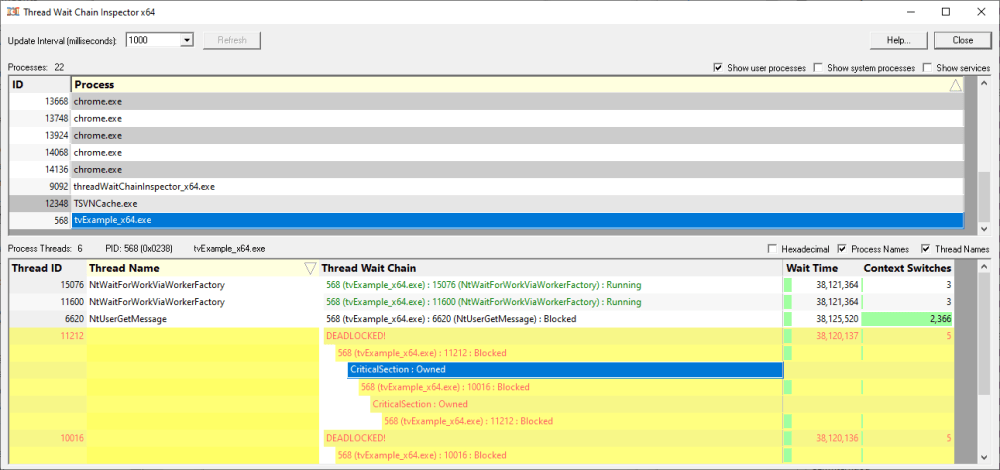
Application Hang Detector allows you to inspect information about each running thread in an application.
The display shows wait chain data in the the lower window for the process that is selected in the upper window.
For any selected thread, that thread and related threads are shown with a yellow background.
Any deadlocked threads have their wait chains shown in red.

Information that is displayed about each thread:
Thread id
This is the numeric identifer assigned to the thread by the Windows operating system.
Thread Name
This is the name of the thread if the thread has been given a name using the SetThreadDescription() API. This is only available on Windows 10.
If a thread description is not available we attempt to provide a name for this thread by querying the thread's start address, and if successful we try to turn this start address into a useful symbolic name. Depending on the process and the operating system these operations may success, in which we display a name, or they may fail in which case we display nothing.
Thread Wait Chain
This is the wait chain for this thread. For each entry we show the process id and the thread id and if the object being waited upon has a name, we show that too. If process names and thread names have been enabled we show these as well. Some wait chains rely on waiting for other processes, which are more readily identified by process name than process id. Any deadlocks that are detected are shown in red.
Wait Time
This is how long the thread has been waiting.
Context switches
This is the number of context switches this thread has been involved in.