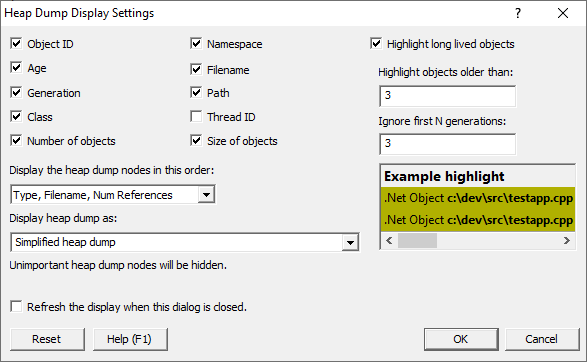
The Heap Dump Display Settings dialog allows you to manage how heap dumps are displayed, both visually and the content of the heap dump.
 Click a part of the image below to jump straight to the help for that area.
Data Display
Various attributes related to the each node can be displayed:
•Object ID  Object ID.

•Age  How many garbage collections since this object was created.

•Generation  The generation this object was created in.

•Class  The object class.

•Number of objects  The number of objects this object references.

•Namespace  The object namespace.

•Filename  The source code filename and line number for the allocation location.

•Path  The source code path for the allocation location.

•Thread ID  The thread id for the allocation location.

•Size of objects  The size in bytes of the number of objects referenced by this object.

Visual Highlighting
To aid identifying long lived objects that may be of interest when trying to find loitering objects that may be leaked you can highlight objects older than a specified age, and created after a specified generation. This allows you to ignore objects created during the startup phase of the application. A example of highlighting is shown below the highlighting controls.
•Highlight long lived objects  Turn visual highlighting of loitering objects on / off.
•Highlight objects older than  How old do you think an object needs to be for it get your attention?
•Ignore first N generations  Enter the number of garbage collections it takes for your application to startup.
Highlighted objects look like this:

Data ordering
When choosing how to order the heap dump there are a few sorting options:
•Num References, Type, Filename  Sort by Num References, then by Type, then by Filename.
•Type, Filename, Num References  Sort by Type, then by Filename, then by Num References. This is the default option.
•Filename, Type, Num References  Sort by Filename, then by Type, then by Num References.
Making the data easier to understand
Heap dumps can be very complicated to understand. The complexity is increased when there are objects present that don't really add to your understanding of the heap dump, but which are present all the same. We've provided some options to allow you to tailor the level of complexity to suit the task.
•Full heap dump  Everything in the heap dump is shown.

•Simplified heap dump  Unimportant nodes in the heap dump are not shown. This is the default option.
What is classed as unimportant? Any node that references no other nodes and has no source code (CLR/.Net Frameworkd source code is not included) and any node that has reference nodes that are classed as unimportant.

•Over simplified heap dump  Unimportant nodes in the heap dump are not shown. Additionally some recursive nodes and some node links are not shown.

The simplified heap dump is easier to display because less data is shown. It includes all recursive nodes and links to other nodes.
The over simplified heap dump has even less data and for many tasks may be easier to understand. But because the recursive nodes and links to other nodes are absent you may get an incorrect sense of the layout of the heap dump.
You need to use the over simplified heap dump with caution.
Auto display
•Refresh the display when the dialog is closed  The display will be completely refreshed. Do not choose this option if you only wanted to change the visual highlighting or data display.
